.png)
During April I challenged myself to tweet 1 reverse engineering tip every day. For your viewing pleasure, here I aggregated all 30 tips. Be sure to follow me @mavlevin for my latest tweets and more reverse engineering extravaganza.
Reverse Engineering Tips
-
long branch-less functions with many xors & rols are usually hash functions.
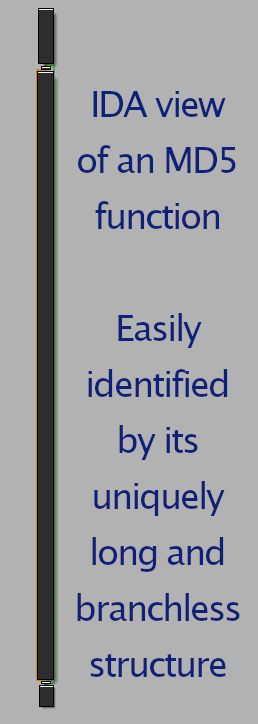
IDA view of MD5 function -
Building on the last tip, after finding a hash function, google its constant to identify the exact hash algorithm.
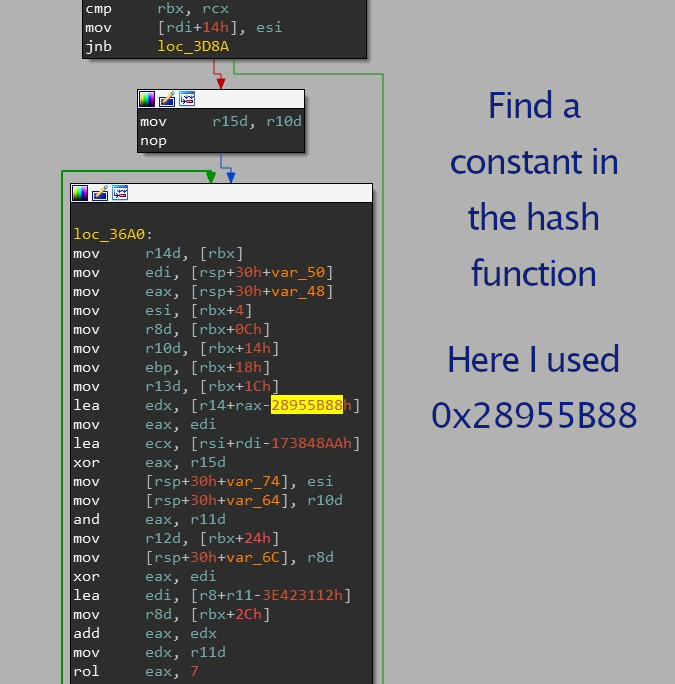
1) select a constant in the hash function 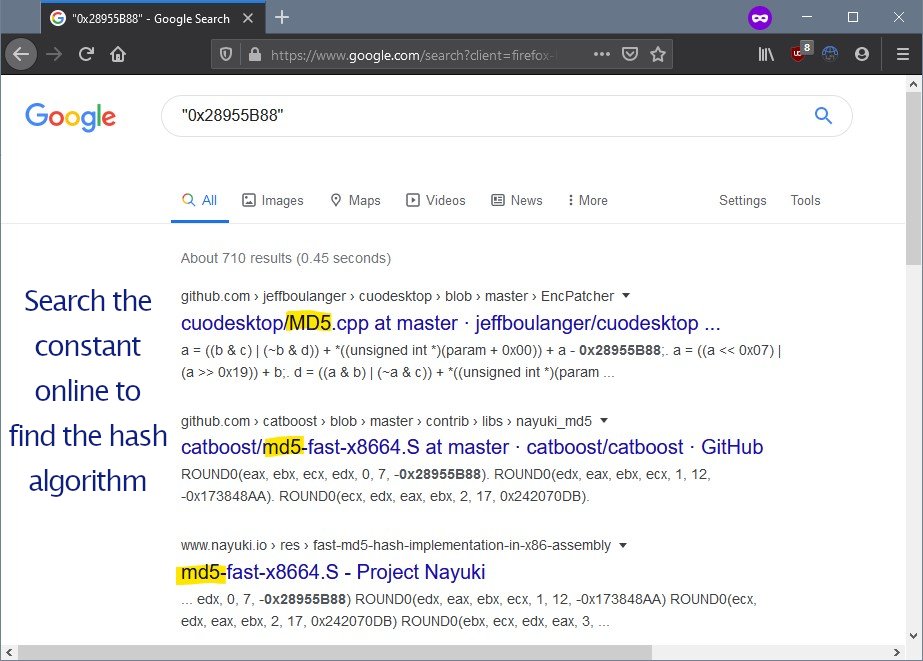
2) search that constant online to identify the hash function. In this example, MD5 -
Find the function controlling authentication in any exe by diff’ing the execution trace of a valid vs failed login. Traces will split right after the authentication check
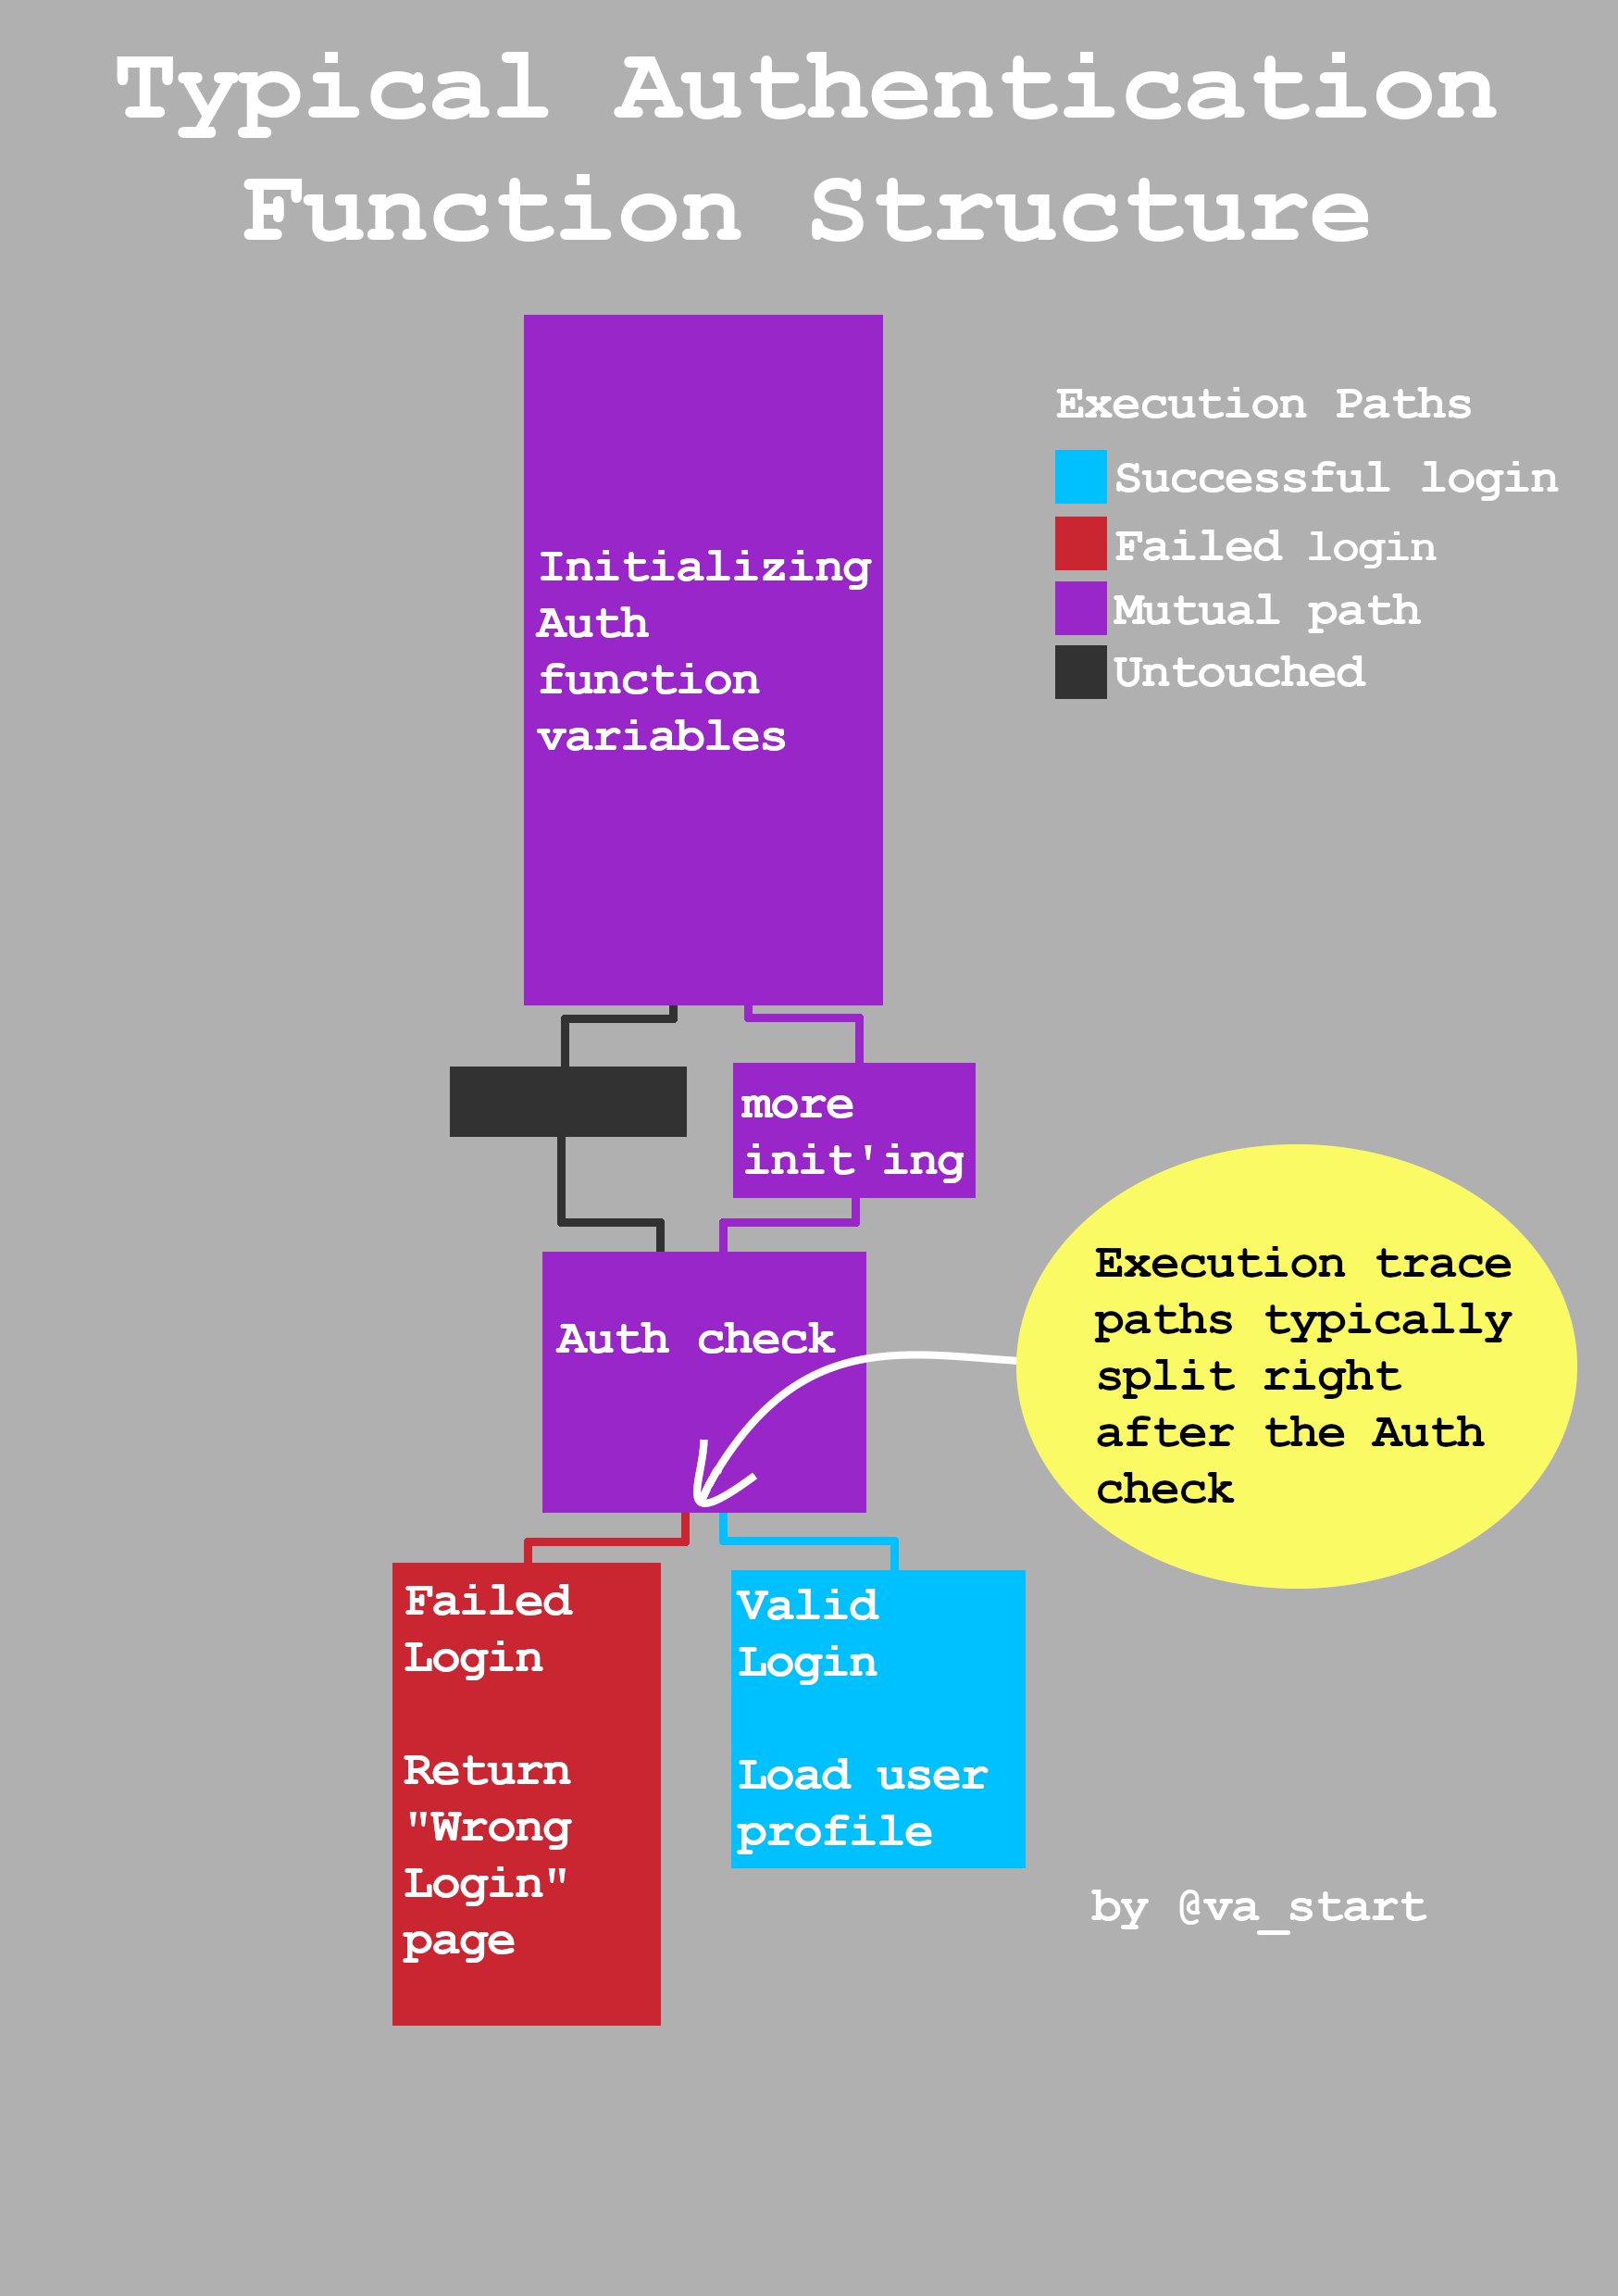
the execution path will change according to if the authentication succeeded You can use Lighthouse to conveniently visualize process execution trace data and operate on multiple traces, showing their shared & unique trace paths
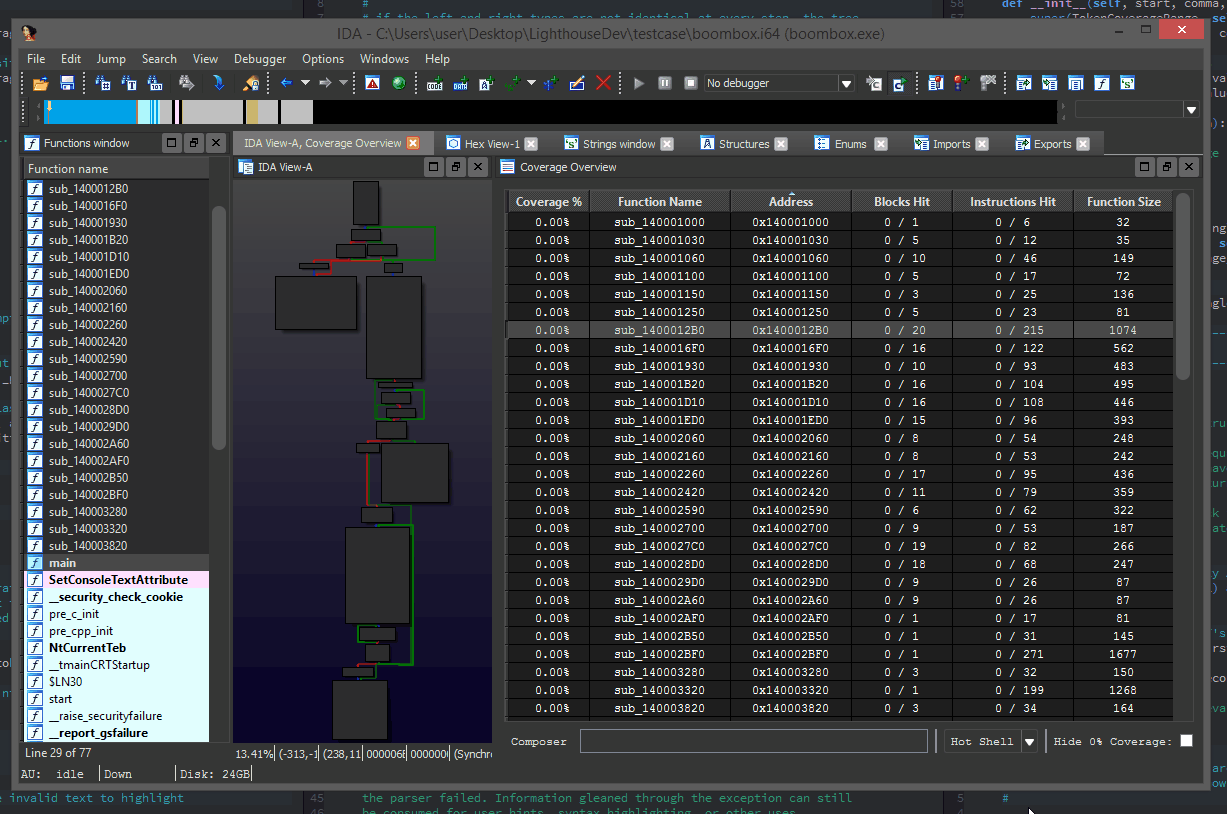
Lighthouse extension in action in IDA - Use a function’s neighboring code to understand its functionality:
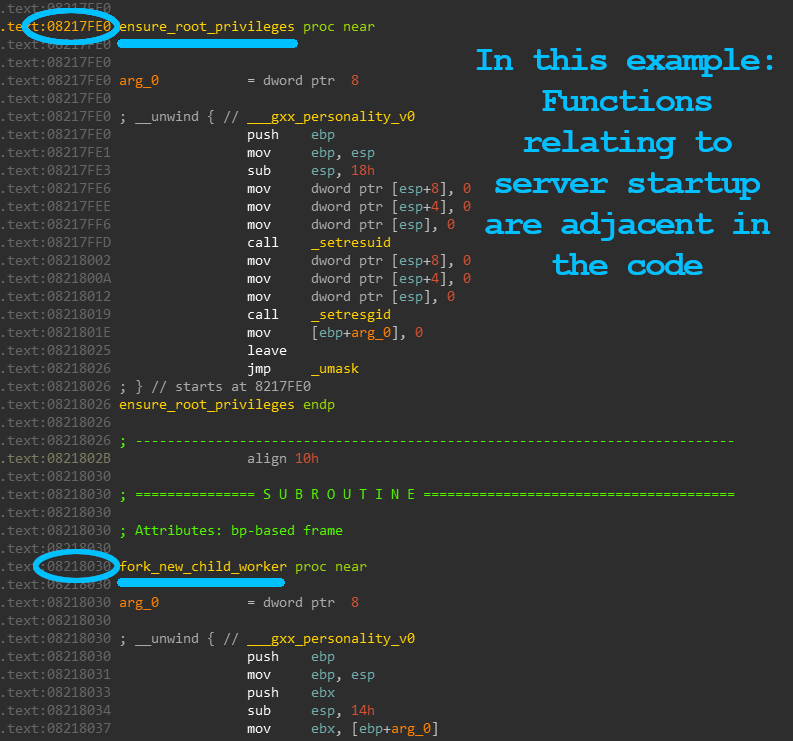
Developers group related funcs together in the same files, and compilers like to keep the order of functions from source to compiled binary. Thus, related functions are closely grouped in the exe
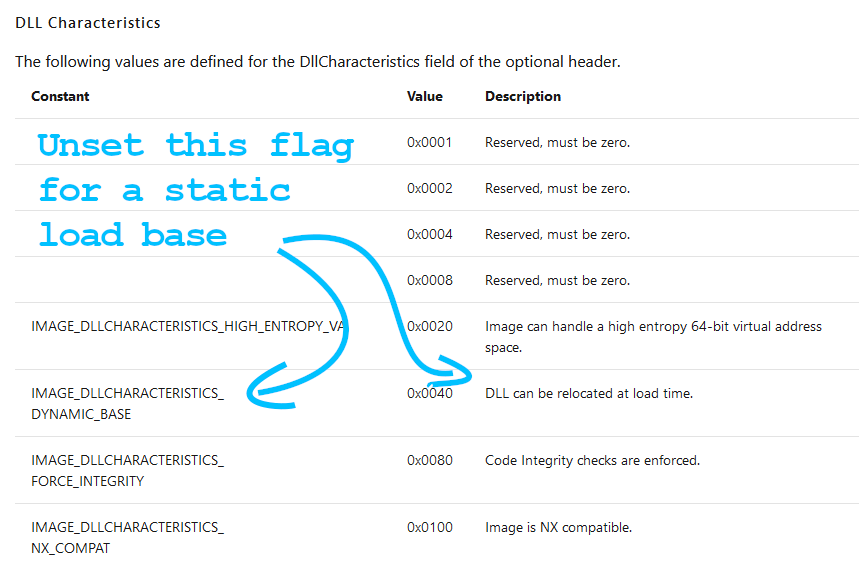
- Hate updating breakpoint addresses each time a module loads with a new base? Patch the PE header of the EXE/DLL to disable the DYNAMIC_BASE flag for a static base address. Here’s a python script that will patch files for you.
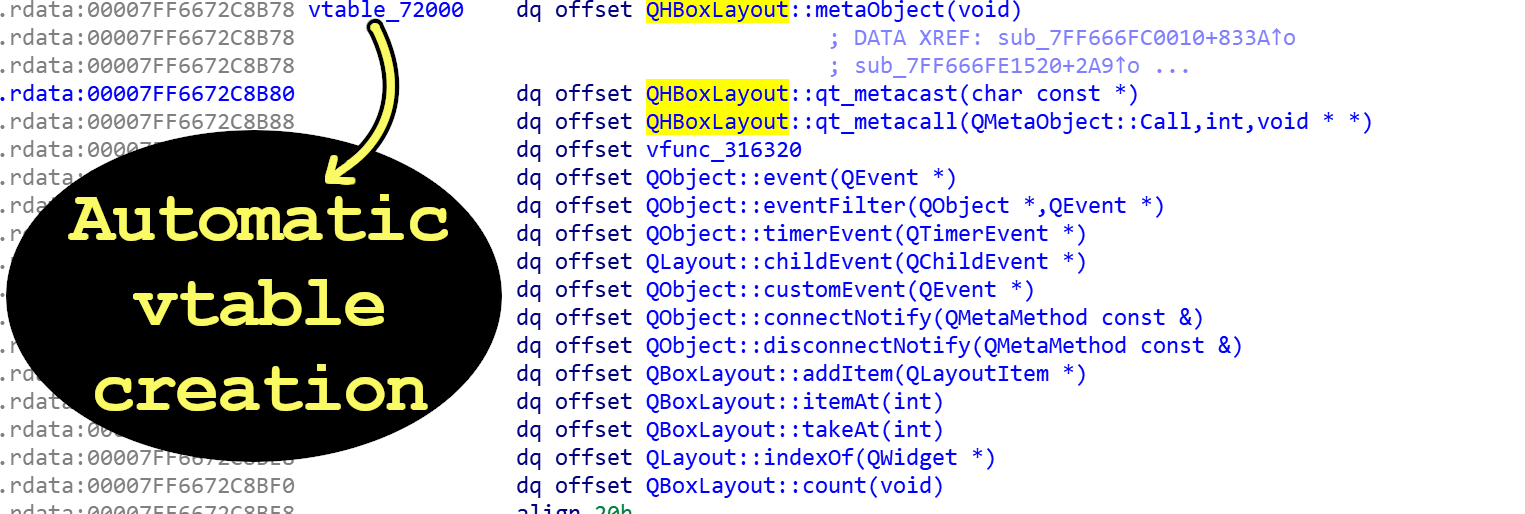
- When reversing C++: Use “virtuailor” to *automatically* create class vtables & add xrefs to virtual functions. It uses runtime inspection to evaluate function addresses to do its magic. Tool written by @0xGalz
-
Reversing is more fun with symbols. So, if the symbols are stripped, try looking for symbols in older versions, versions for other OSs, beta builds, and the mobile app versions.
If still no symbols are found, check which has the most debug prints.
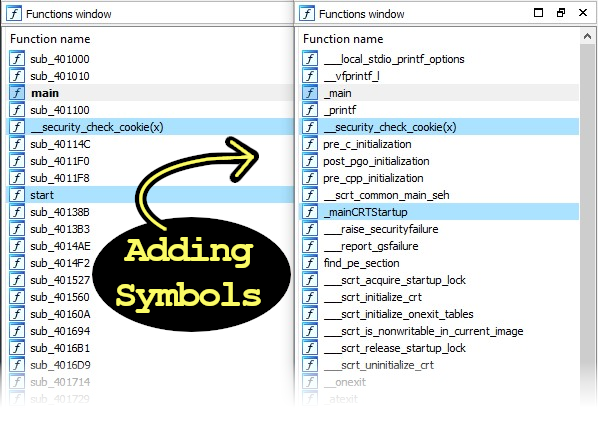
IDA Function list before and after adding symbols - Want a faster way to open IDA on your exe? Add it to the Windows “send to” menu
- open Explorer
- enter “sendto” in the path bar
- drag an IDA Pro shortcut to this folder
- You can now right-click “send to IDA” on any file
- Profit!
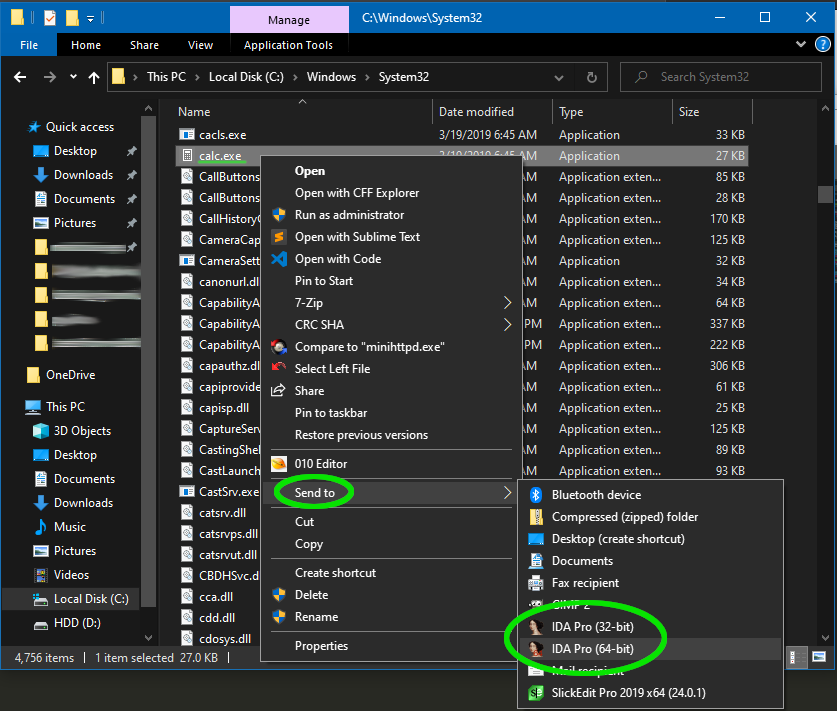
IDA in the send to menu Bonus: this works for other programs too! Drag shortcuts to your favorite programs into that folder, and they will be available through the “send to” menu too
-
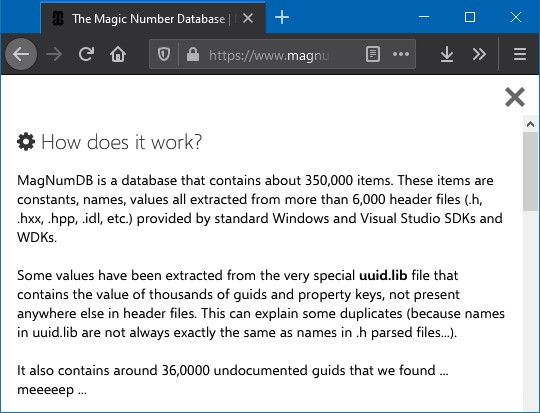
Search http://magnumdb.com to name any unknown Windows constant/guid/error code you come across while reversing
How MangNumDB works 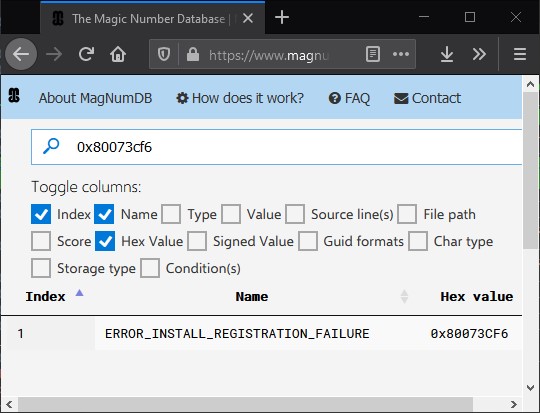
Searching in MangNumDB -
Pimp your gdb experience with ‘layout asm’ and ‘ layout regs’, or take it a step further by installing pwndbg
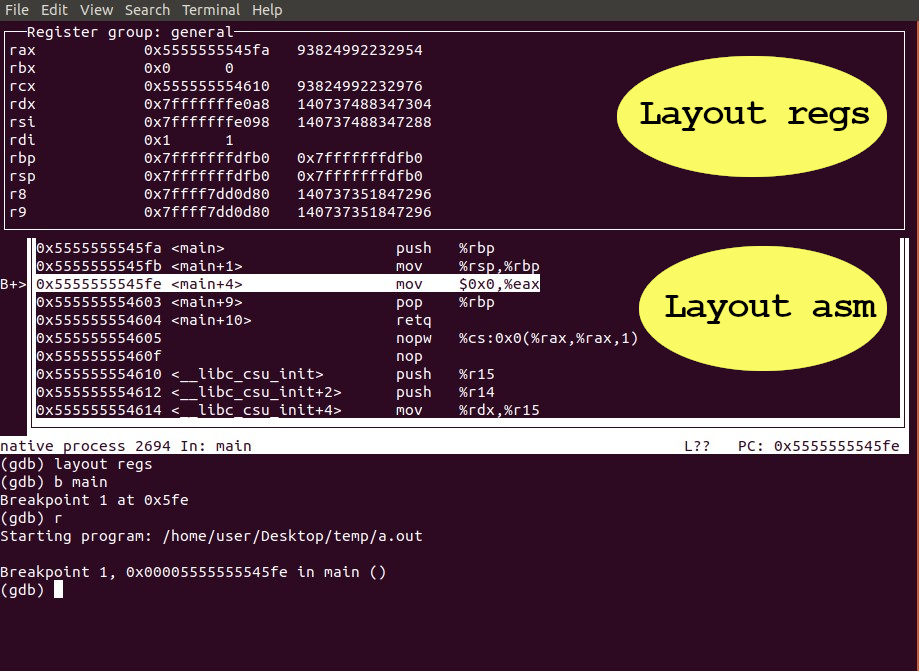
‘layout asm’ and ‘layout regs’, 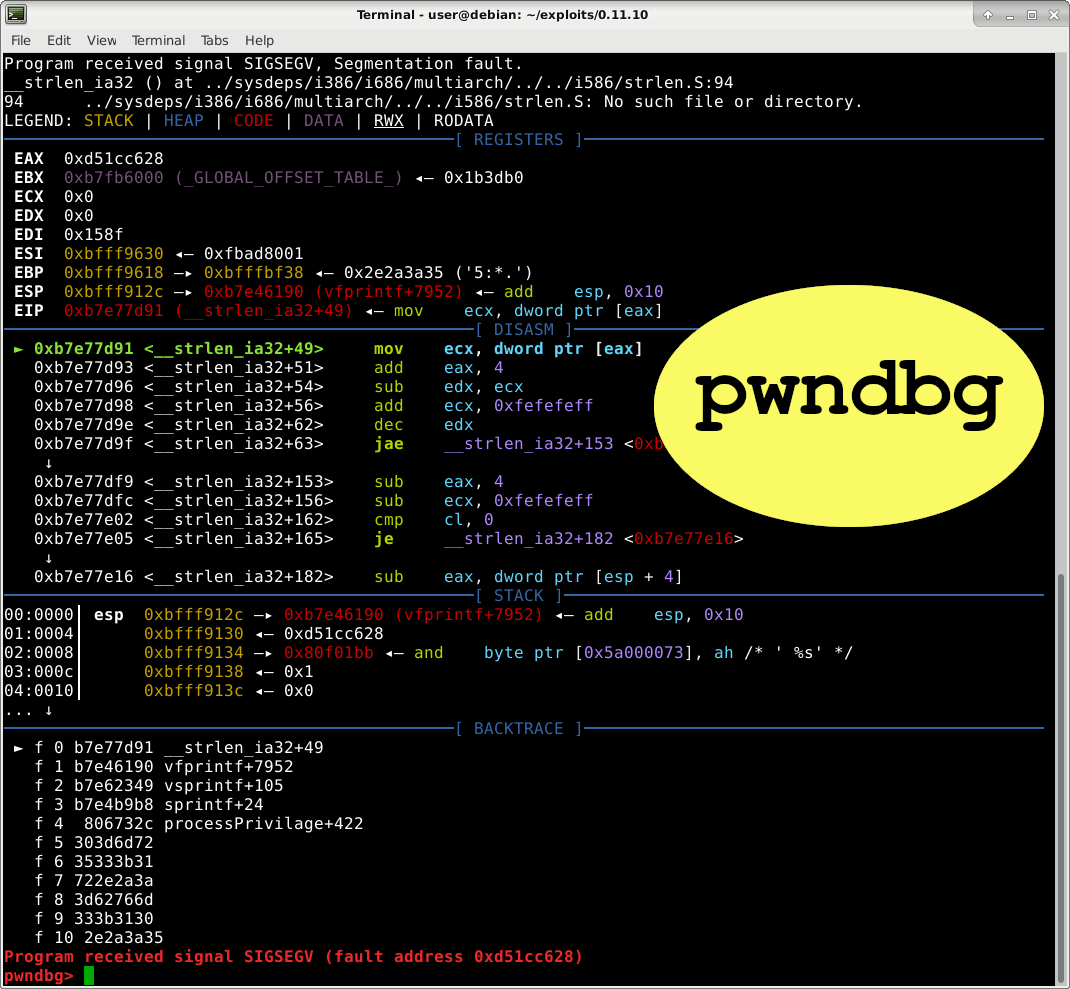
gdb with pwndbg installed -
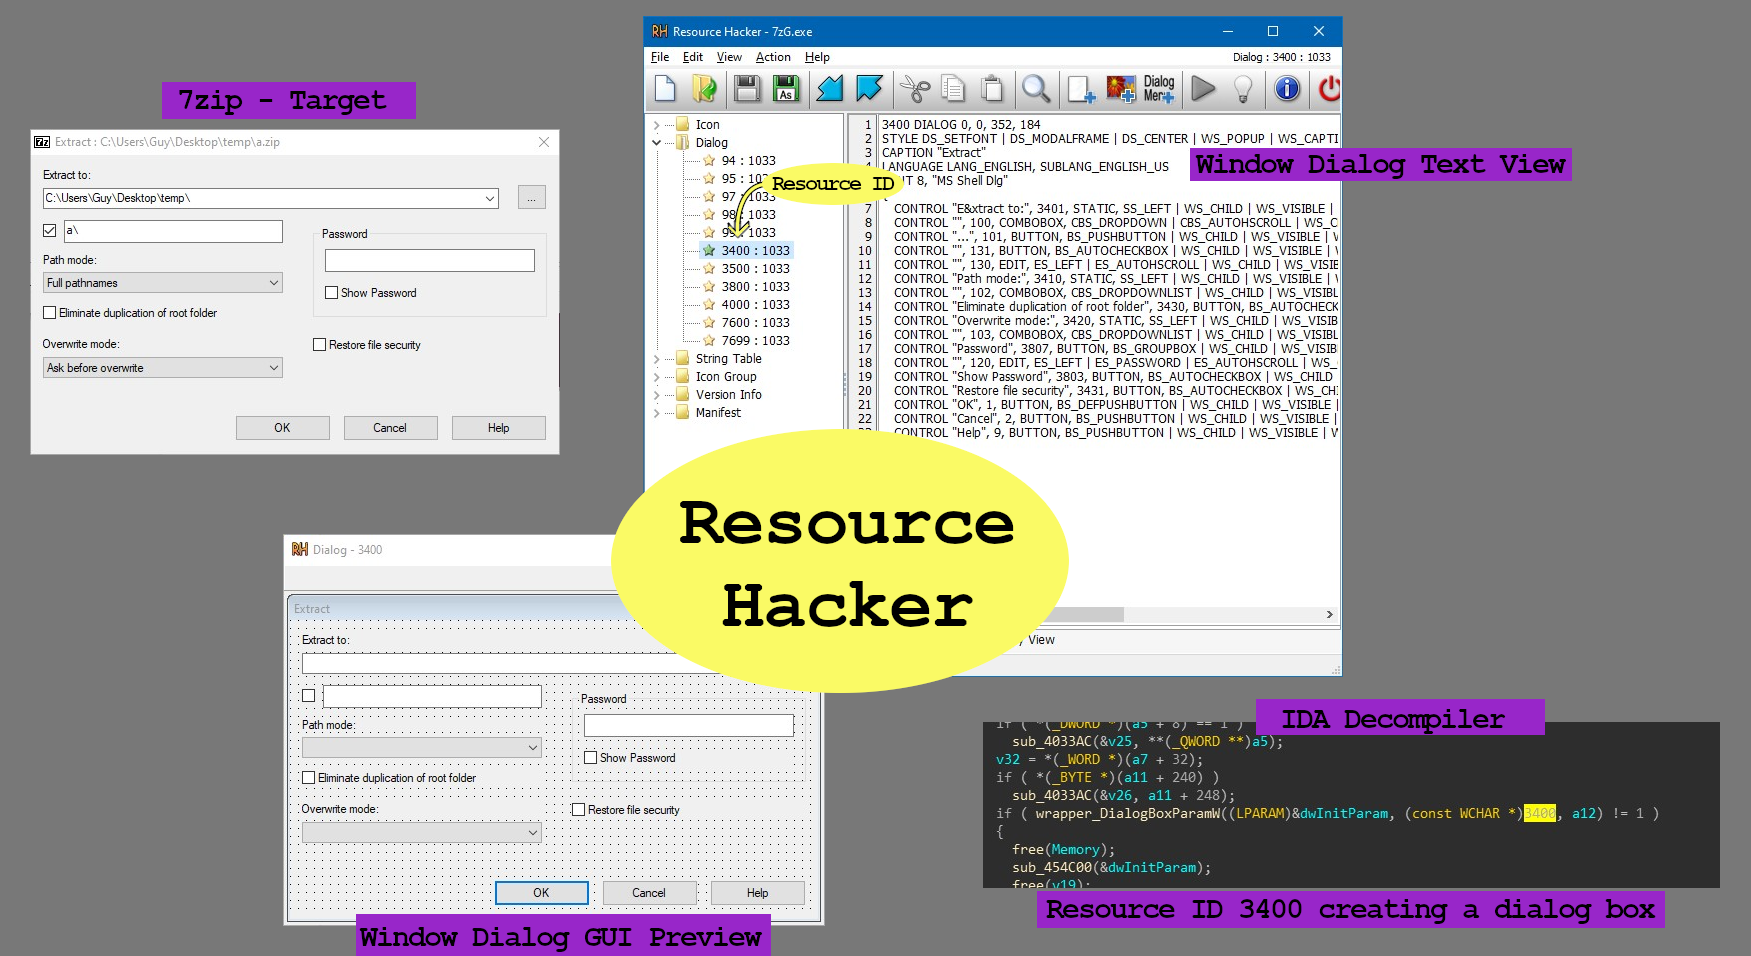
Want to reverse engineer code handling a GUI window? Find the window’s Resource ID with ResourceHacker, then search IDA for where that ID is used (alt+I to search in IDA). I used 7zip In the example below
-
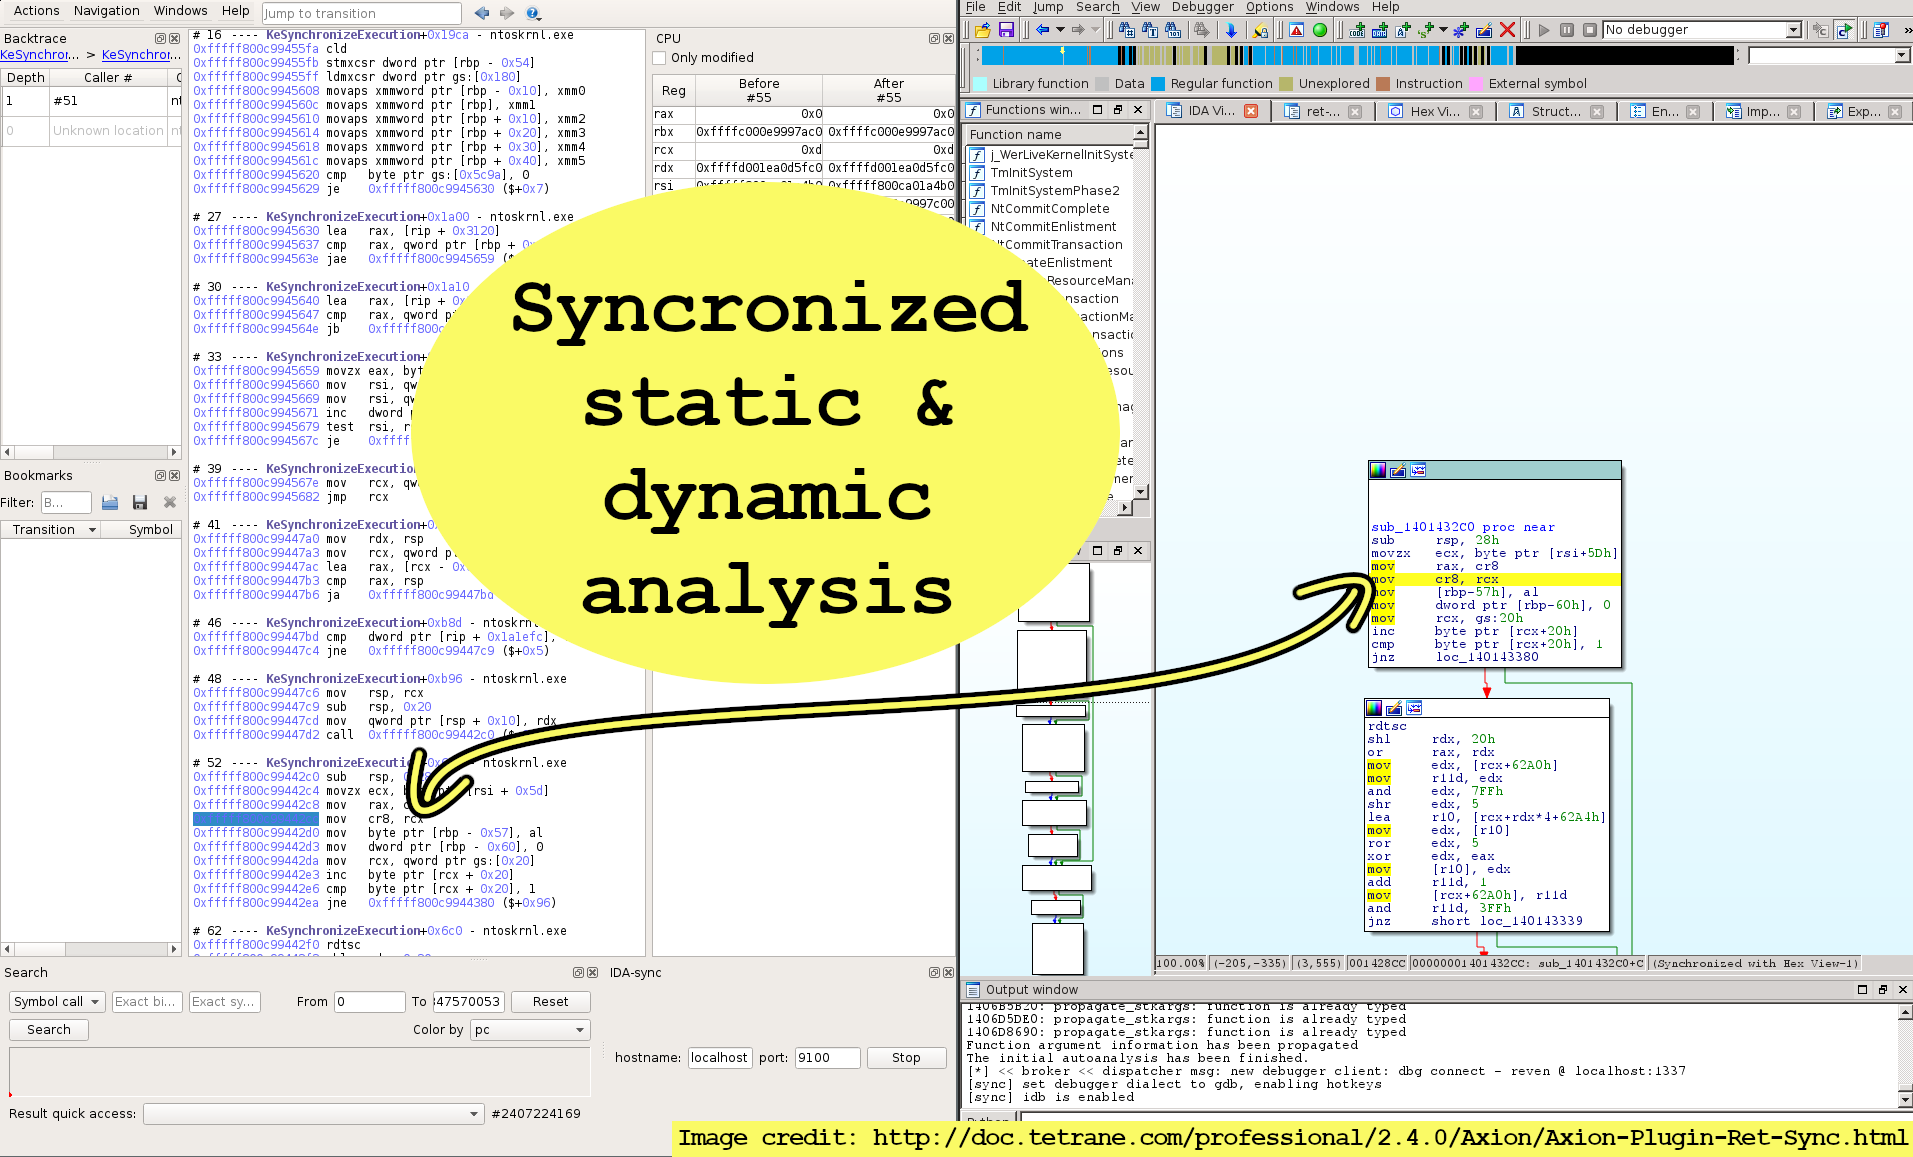
Get the best from both static & dynamic analysis by sync’ing your debugger (WinDbg/GDB/x64dbg/ and more) with your disassembler (IDA/Ghidra) through Ret-Sync
-
Optimized magic numbers can uncover functionality. For example: 0x7efefeff is used in strlen, and 0x5f3759df is used to find the inverse square root (1/sqrt(x))
Further reading: http://lrdev.com/lr/c/strlen.c, https://en.wikipedia.org/wiki/Fast_inverse_square_root
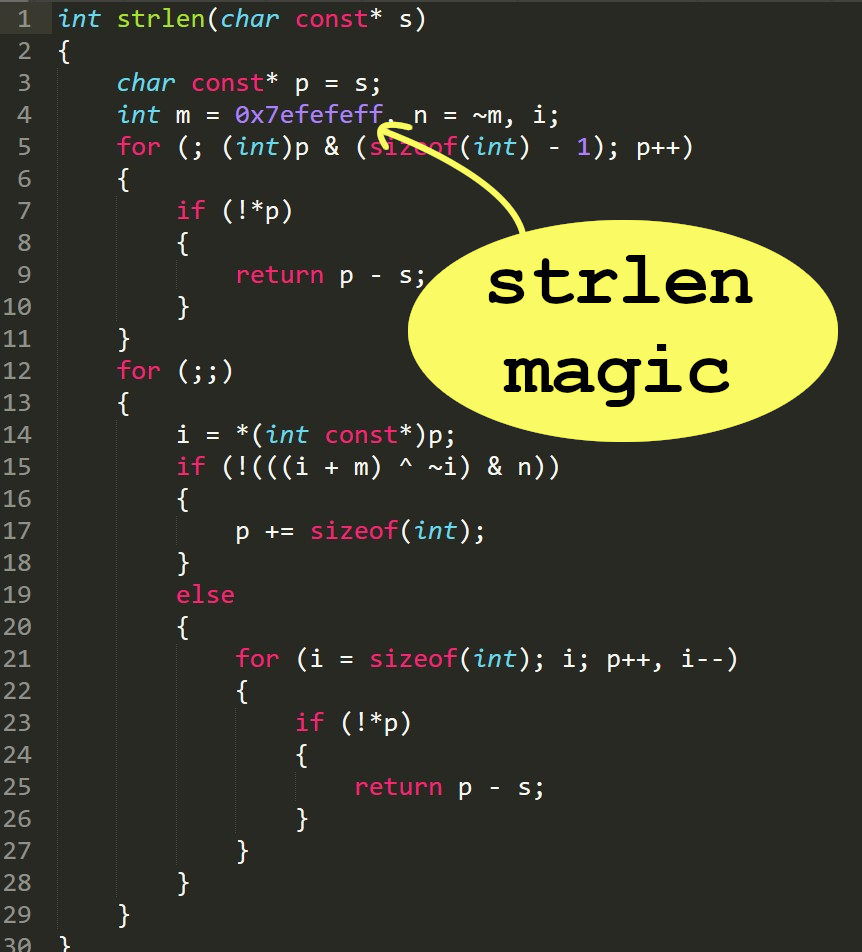
as the number appears in strlen source code 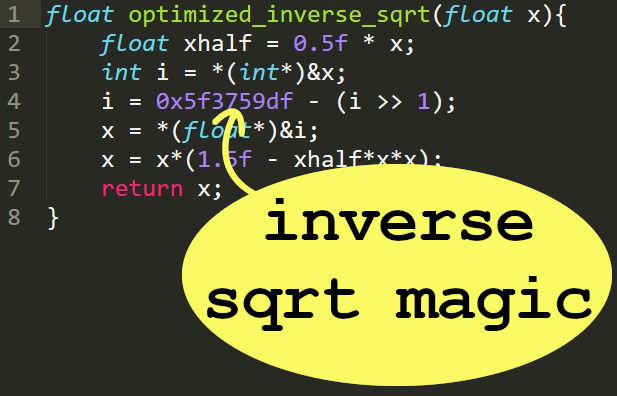
as the number appears in inverse square root source code -
Multiplying by a constant followed by +’ing then shifting(>>) can be a sign of optimized division.
For example: multiplying by 0x92492493 is the first step in efficiently dividing by 7.
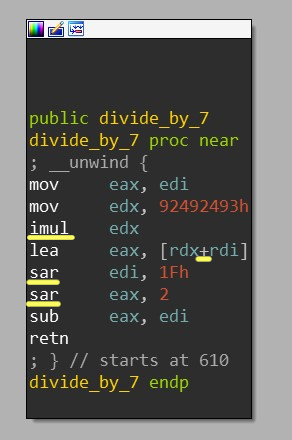
optimized division by 7 in assembly Fortunately, IDA’s HexRays usually simplifies this for us in its x64 decompiler. Decompiled view:
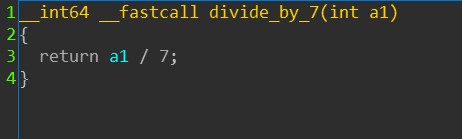
IDA decompiling optimized division by a constant -
In IDA’s disassembler, you can use the numpad +/- keys to change the number of args passed to a function with variable arguments such as printf
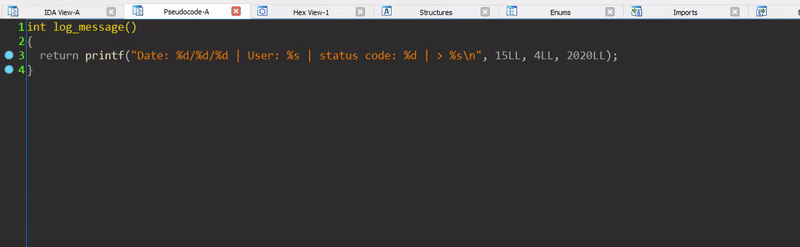
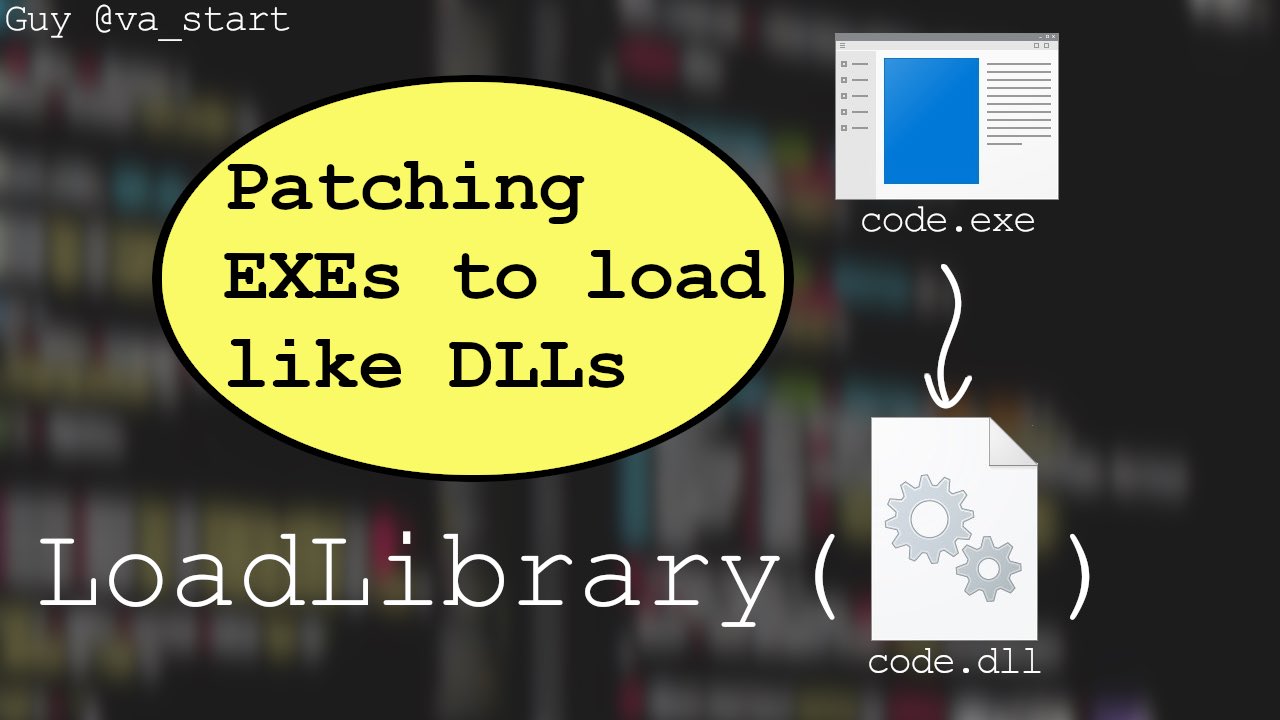
adding and subtraction arguments to printf call - Running controlled input on a function we’re reversing is incredibly useful. You can do this by “converting” the function’s EXE to a DLL, and then invoke the function as if it were a regular exported DLL function. Explanatory blog post I wrote
-
Have you extracted embedded firmware but had trouble figuring out its base address to load into IDA? Take clues from string ptrs: use a script such as https://github.com/sgayou/rbasefind to find which base address aligns the most poinetrs to valid strings and go according to that.
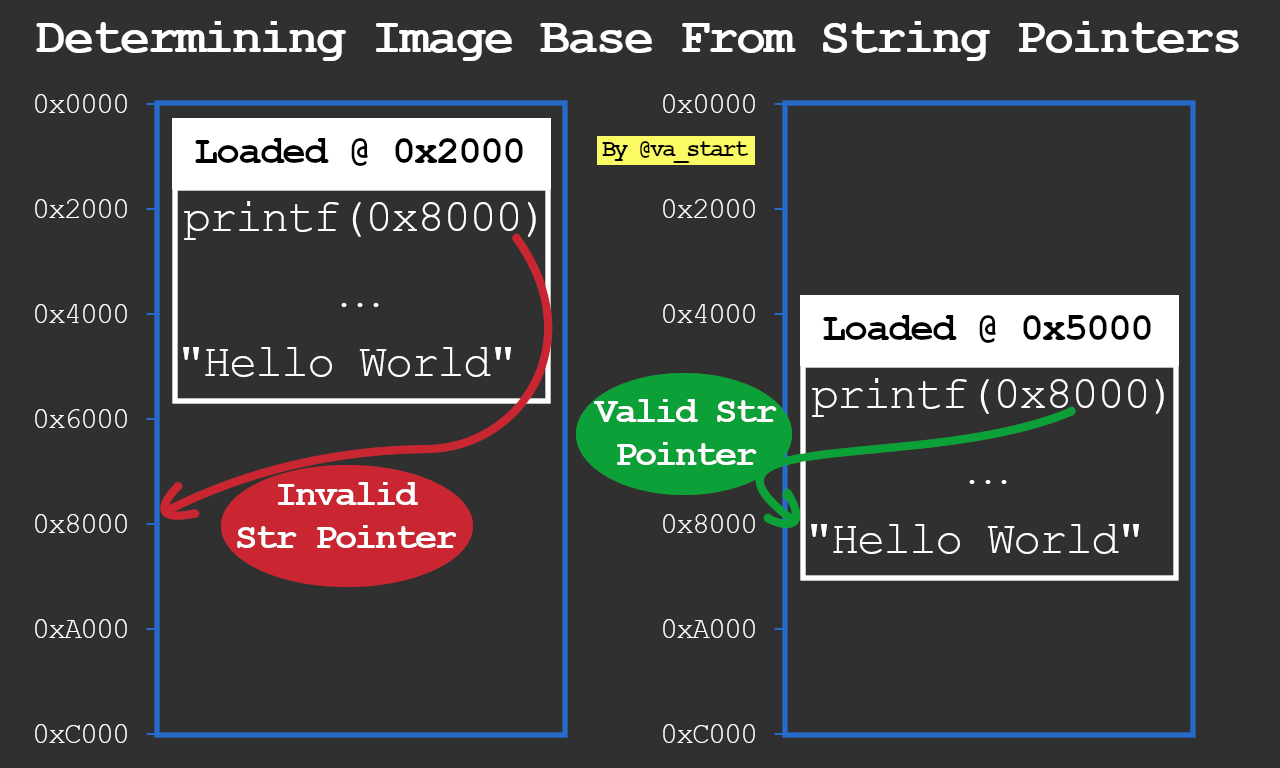
string pointers give clues to the binary's base offset By the way, the linked code is written in Rustlang, a treat for all you rust lovers ;) <3
-
Building on the last tip, another way to find a fw’s base addr is using absolute calls: Find which base address results in the most calls “landing” at the beginnings of functions (code init’ing the frame pointer & allocating stack vars)
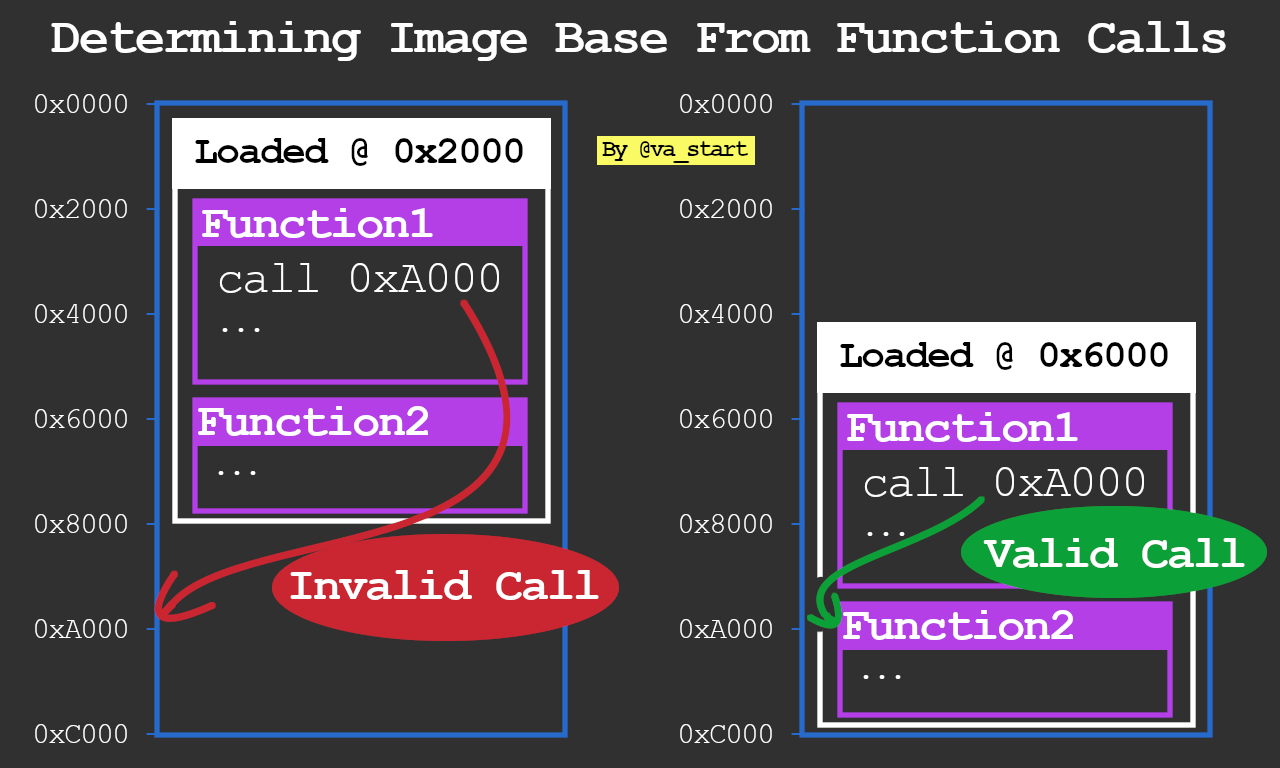
Absolute function calls algo give clues to the binary's base offset -
Did you find a bunch of strings, but no xref to their use? You probably found a str array: the strs are accessed through an offset from the 1st string (array base), which will have an xref
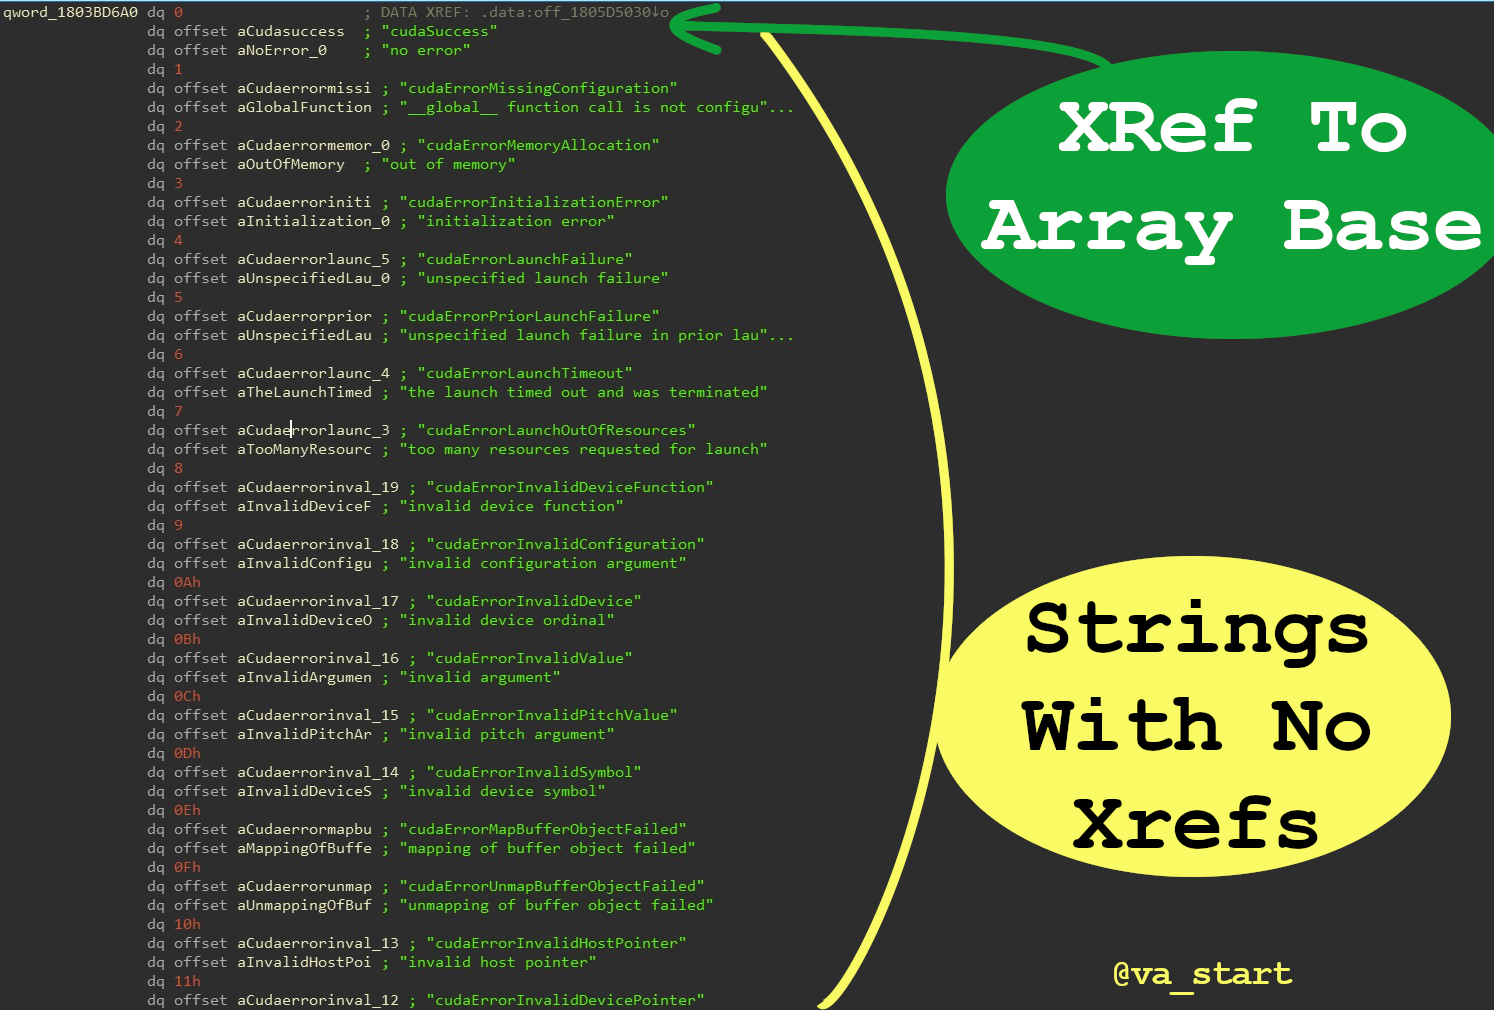
Code above is from Nvidia’s NvCamera64.dll. Specifically in this example, I found an array of structs in the form <ErrorCode, ErrorString, ErrorDescription> (the example isn’t a pure string table, but a struct table).
Also, the ErrorCode field is redundant as it can be determined from the struct’s index in the array. Error ID 0 = ErrorTable[0]
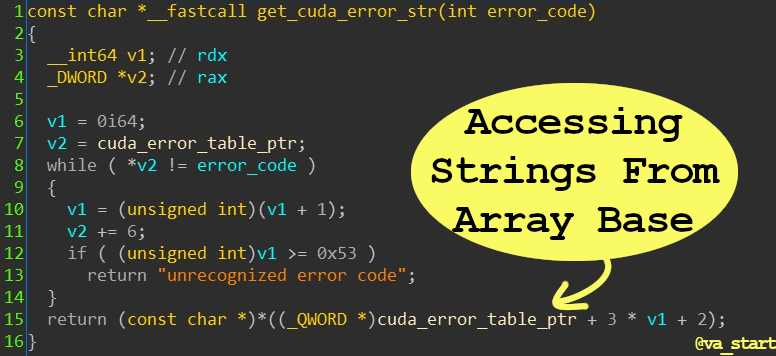
After creating a struct and defining proper types, this is the decompiled code: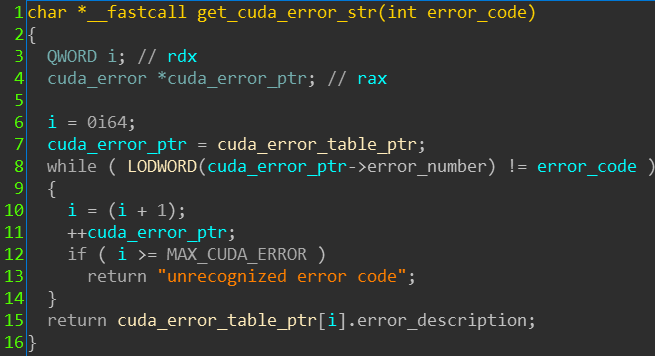
- Tips to improve your GDB debugging
- GDB Tip 1:
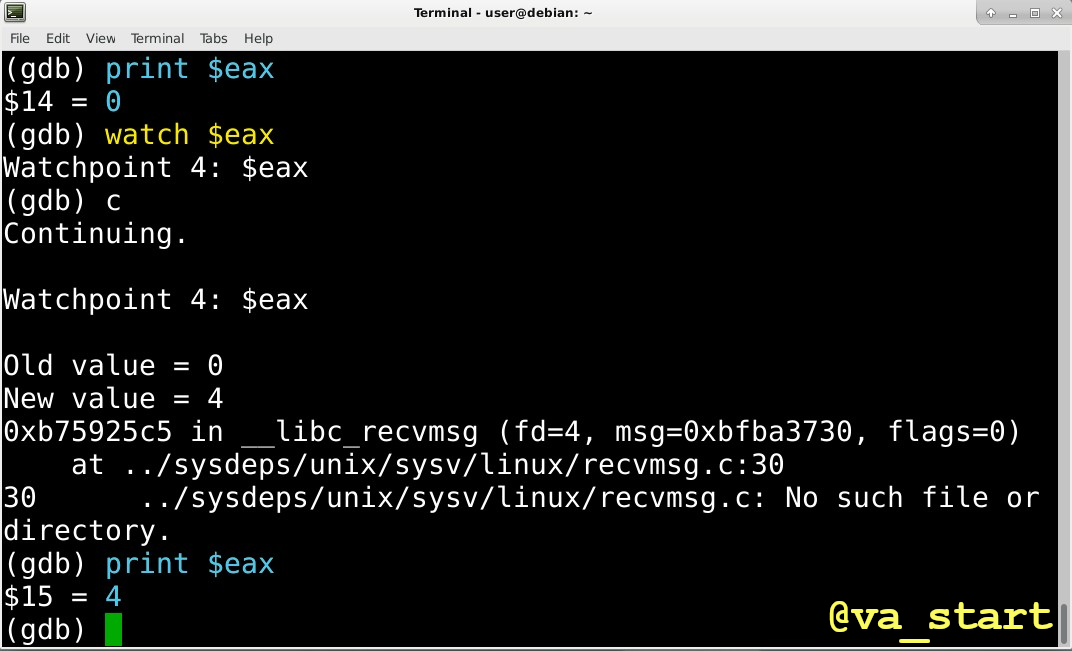
The ability to break on reading/writing memory is well known, BUT did you know you can break on a write to a register?
register watchpoint in GDB - GDB Tip 2: Anytime GDB prints $<number>, it is actually creating a new variable you can use:
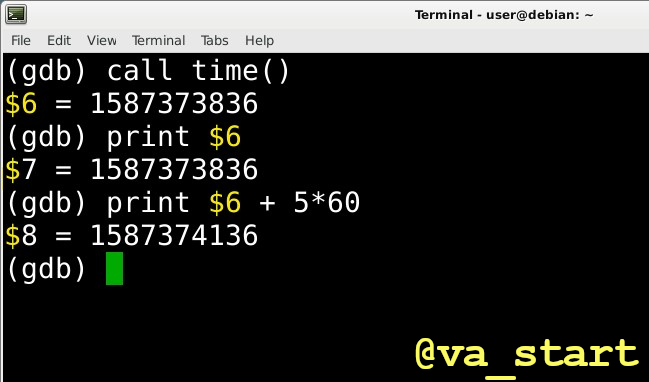
everything starting with a $ sign is a variable in GDB -
GDB Tip 3: 3 ways to write to memory in GDB (commands in back-ticks):
- use
set callmemcpy/strcpy- write data from a file to memory with
restore
- use
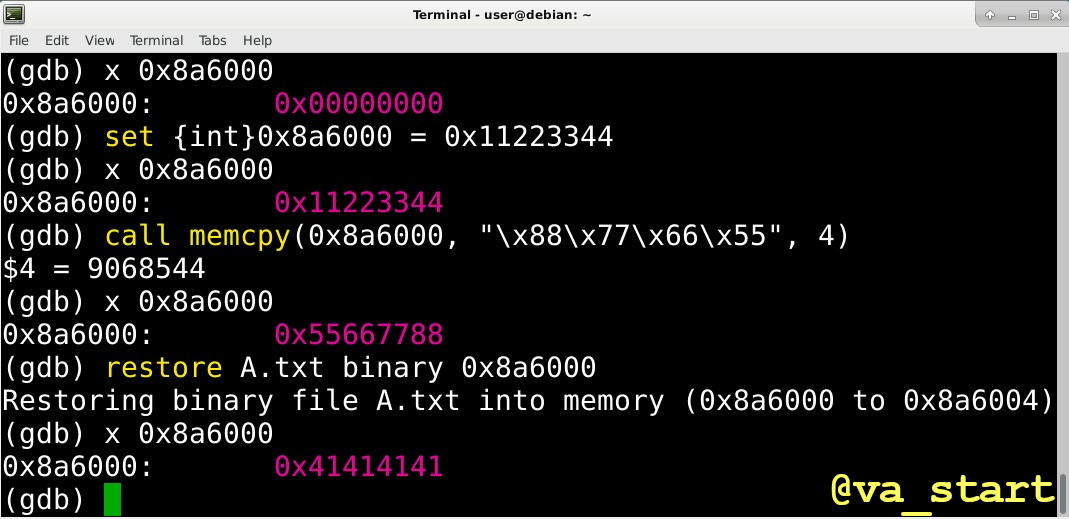
different ways of writing to memory -
Trick to help find popular libc functions in oceans of code: take advantage of their high xref count. Commonly used function like
memcpyandstrlenwill be invoked often, whilestrtokfor example will be used much less. -
Reverse Engineering String hunting tips
Strings help identify code functionality: finding the “login successful” string will show you were the login logic is. But how can we search for a string we target program use if it’s not IDA’s strings GUI window?-
The strings window only has auto-identified strings, which misses some.
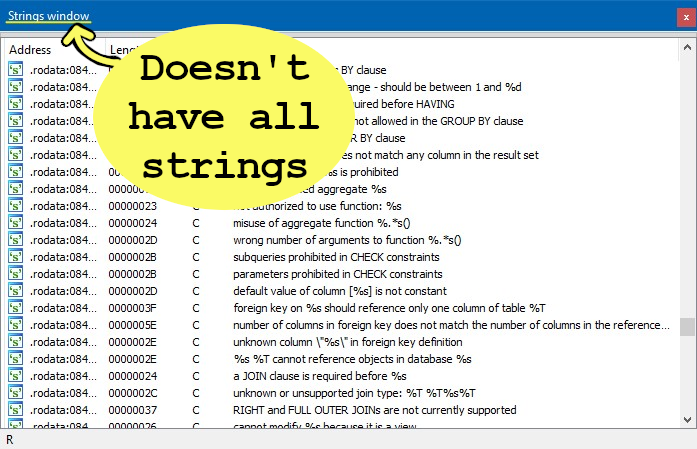
IDA's string windows only shows automatically identified strings found through heuristics, often missing some -
Use ALT-B to search the whole binary, even places not identified as data regions.
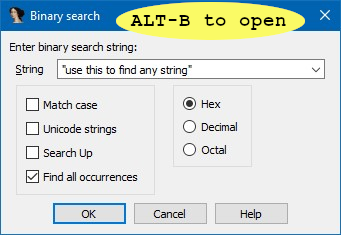
use ALT-B to search for strings -
Sometimes the string isn’t embedded in the binary, but is imported from an external resource file. Find these strings by grepping the program’s installation folder (usually that’s where the resource files are too)
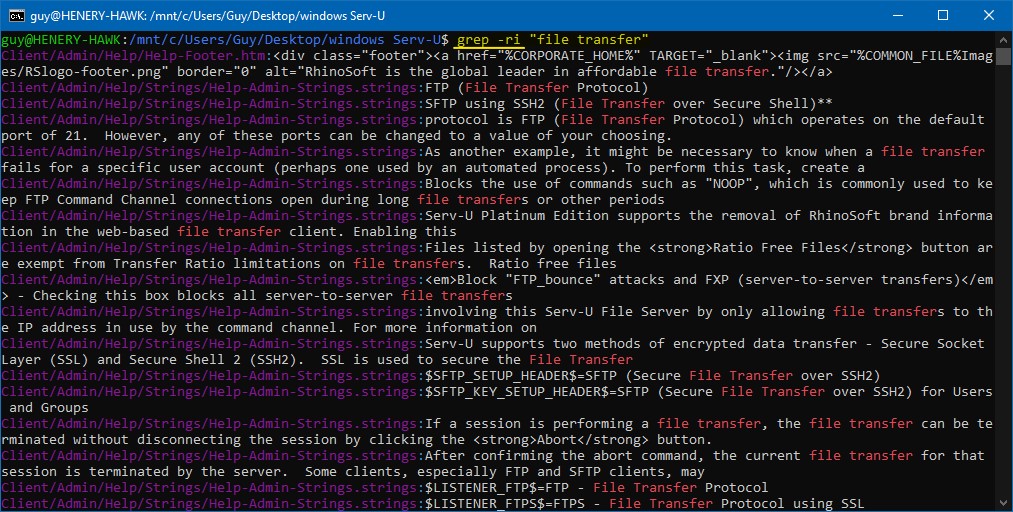
using recursive grep to find a string in the program's installation folder -
Another method is Googling the string to see if it’s system generated. Error strings especially, might be take right from library functions such as perror()/FormatMessageA(), in which case the string won’t be in the exe
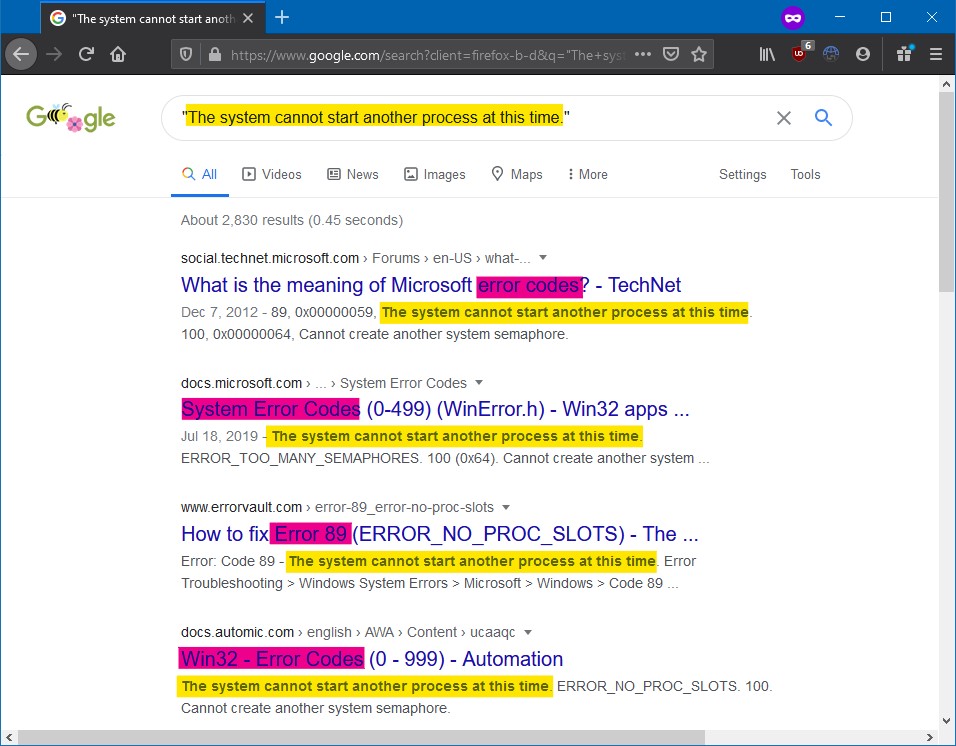
for example, 'The system cannot start another process at this time' is a system error message that likely won't be found in the executable binary -
Last resort to find where a used string is loaded from: Time Travel Debugging.
- Start debugging the program with Time Travel Debugging
- when the string appears, scan the program’s memory for its address in ram
- go back in time to find when/where the string was put there Time travel debbugging overview
-
-
The easiest way to find the
main()function is by working in reverse: find which function’s return value (saved in eax) is passed toexit()- that’smain()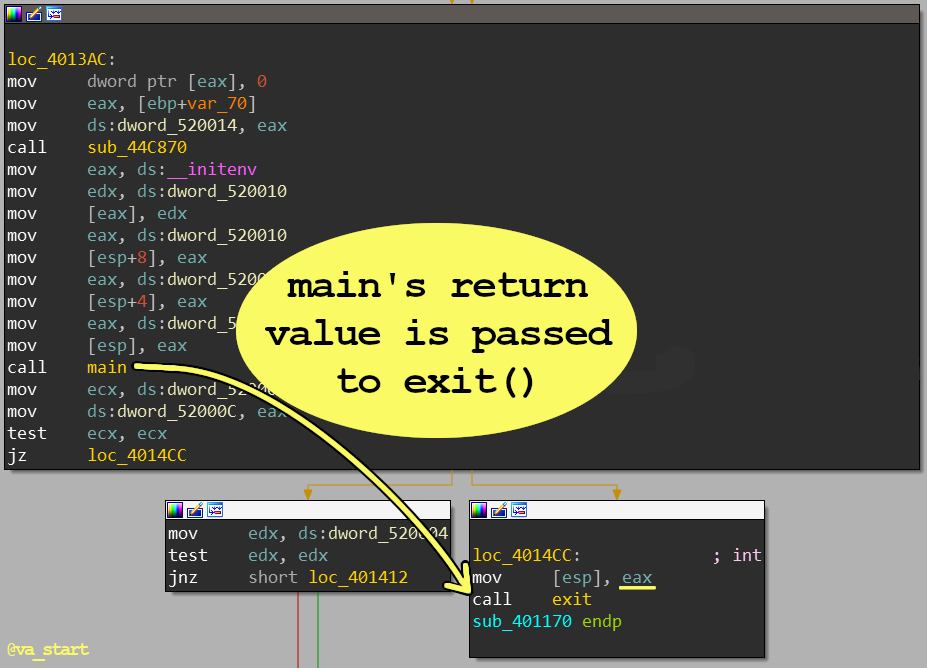
-
Looking to find code handling certain logic?
Search previous versions’ release notes to find when that logic was last updated. Next, bindiff the version before and of that release. The difference will include your target logic.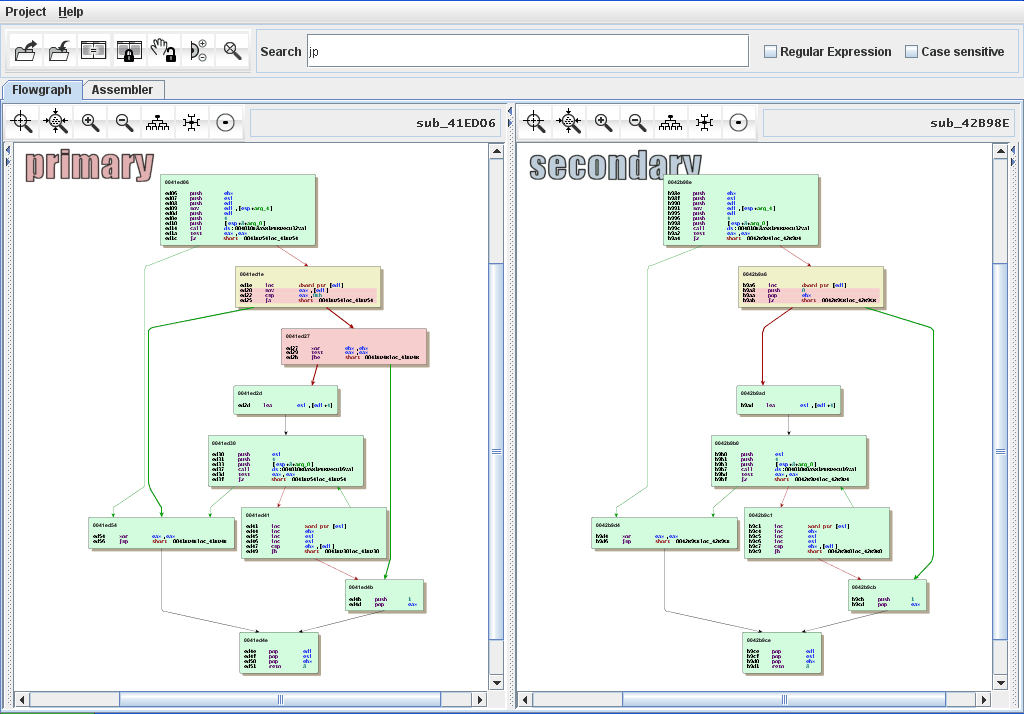
Bindiff tool showing what has changed between two version of a binary -
Get the best from both IDA’s decompiler & disassembler by overlaying the C code on the ASM in graph view (by clicking the “/” key)
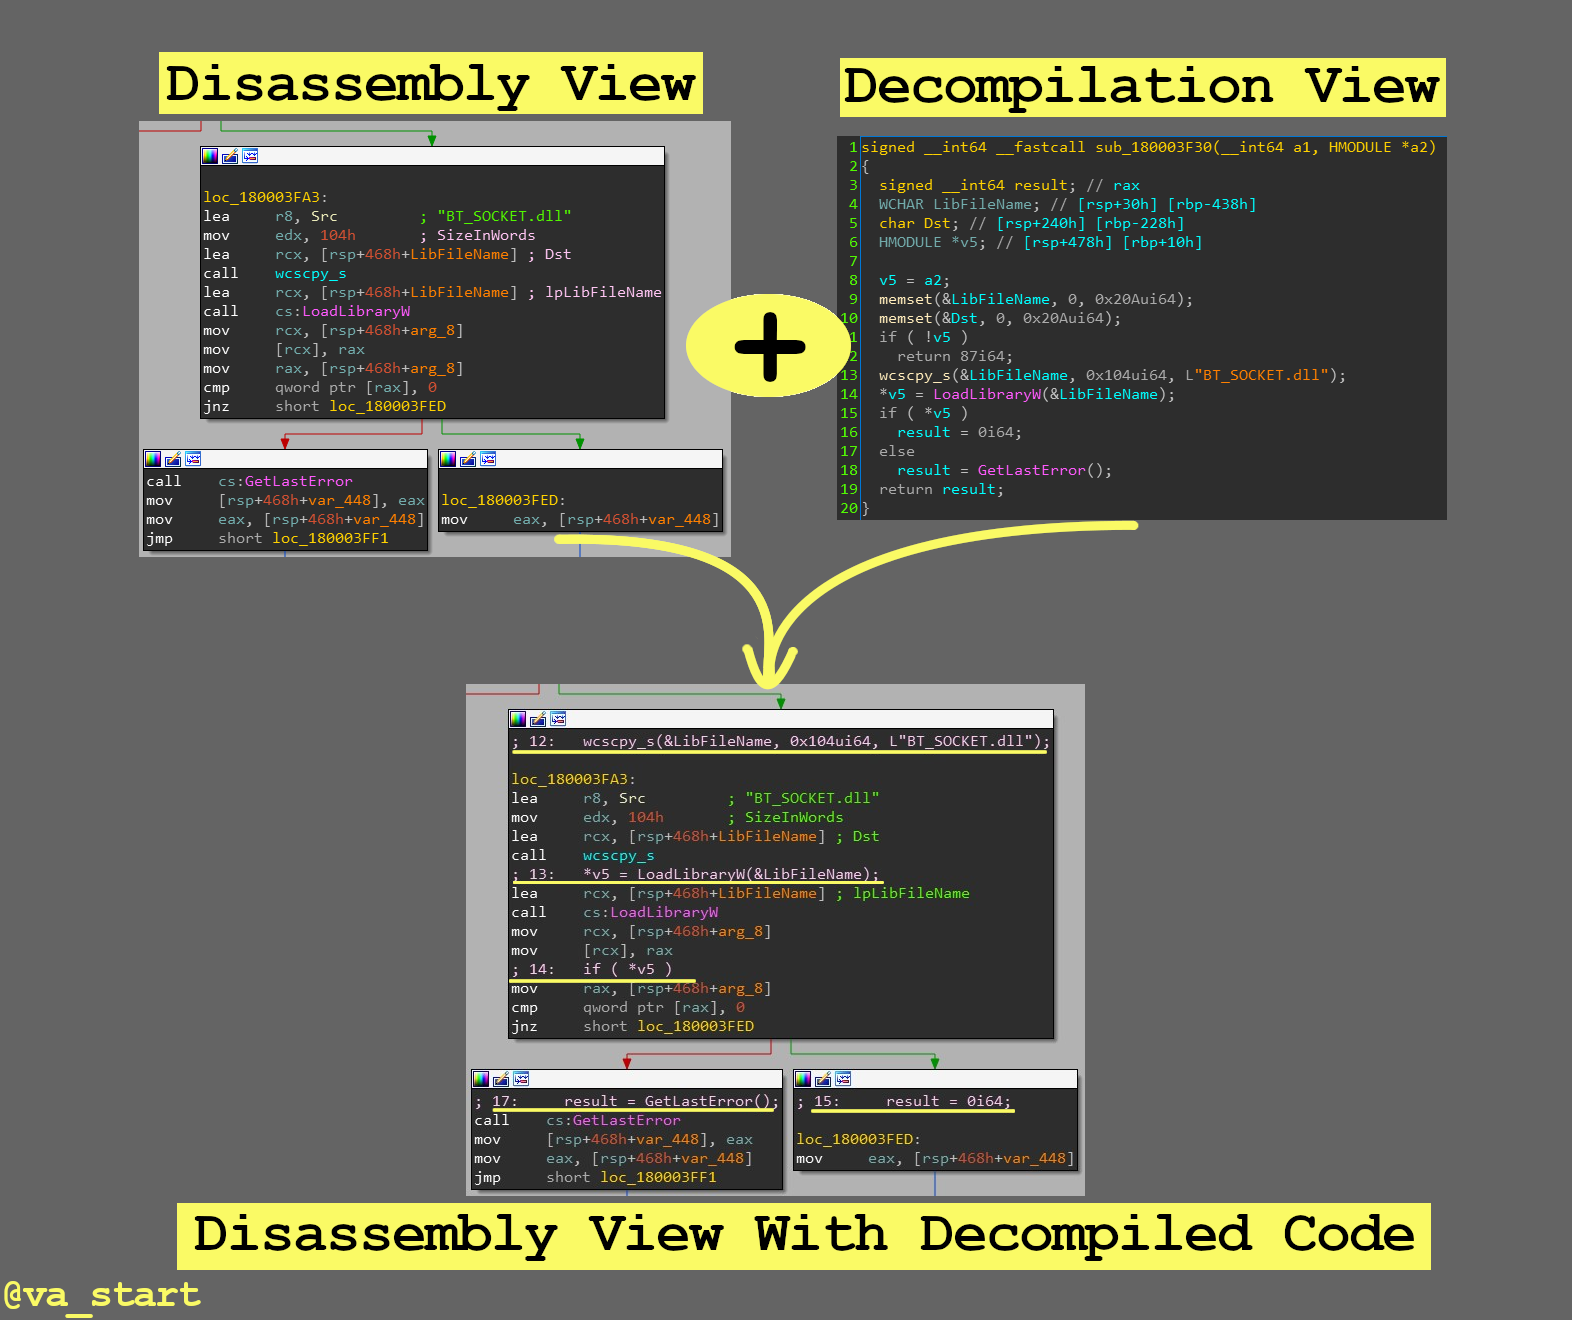
combining views -
Ensure malware you’re researching won’t accidentally run by appending “.dontrunme” to the extension, which will prevent Windows from executing the file when it’s double clicked. On linux just
chmod \-x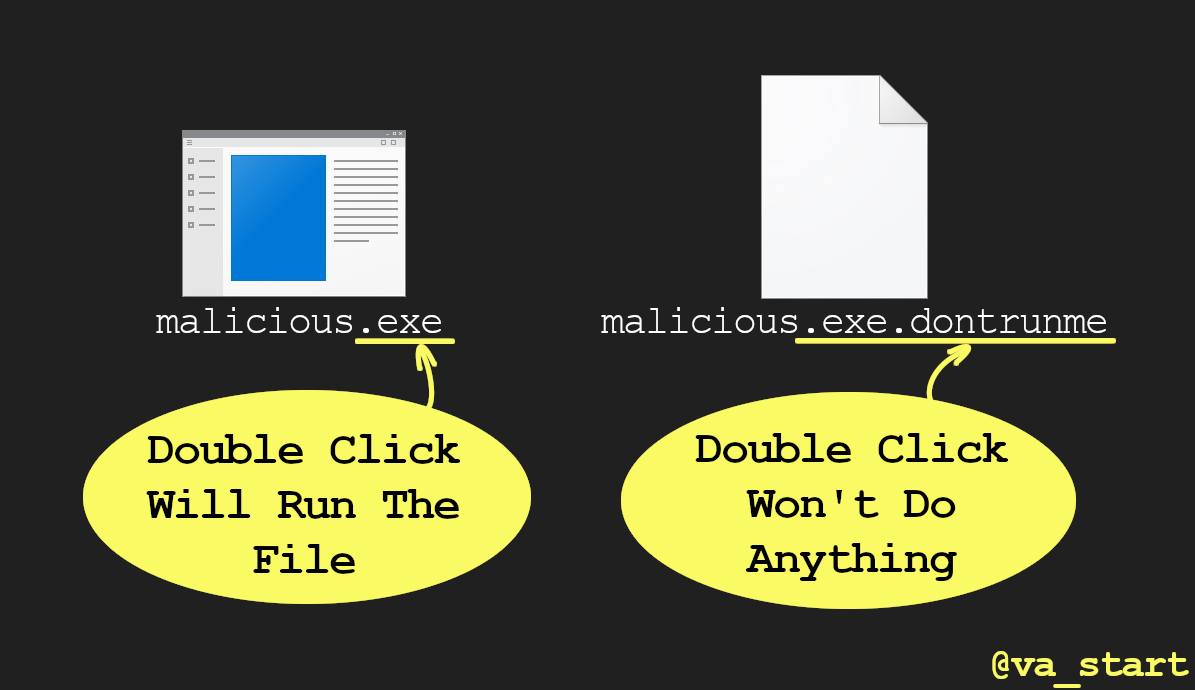
change the extension to prevent accidental infection Any non-system extension like “.abcdefgh” will work, though I like “.dontrunme” because it’s clearer.
-
Sometimes you can reverse a function solely by looking at its call graph. The function calls to/from a target reveal a lot about what the function does. Let’s analyze some examples.
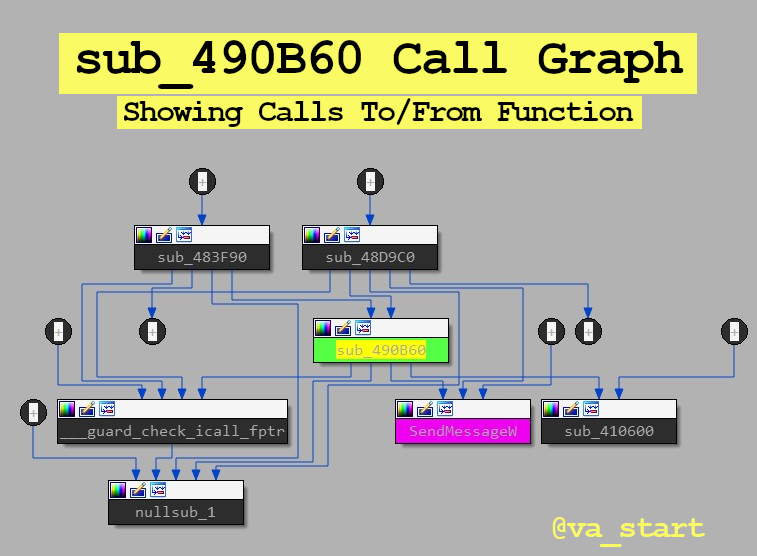
function sub_4a6c60’s call graph is below. Focus on direct calls (direct arrow from sub_4a6c60 to somewhere else) and make an educated guess about sub_4a6c60’s functionality
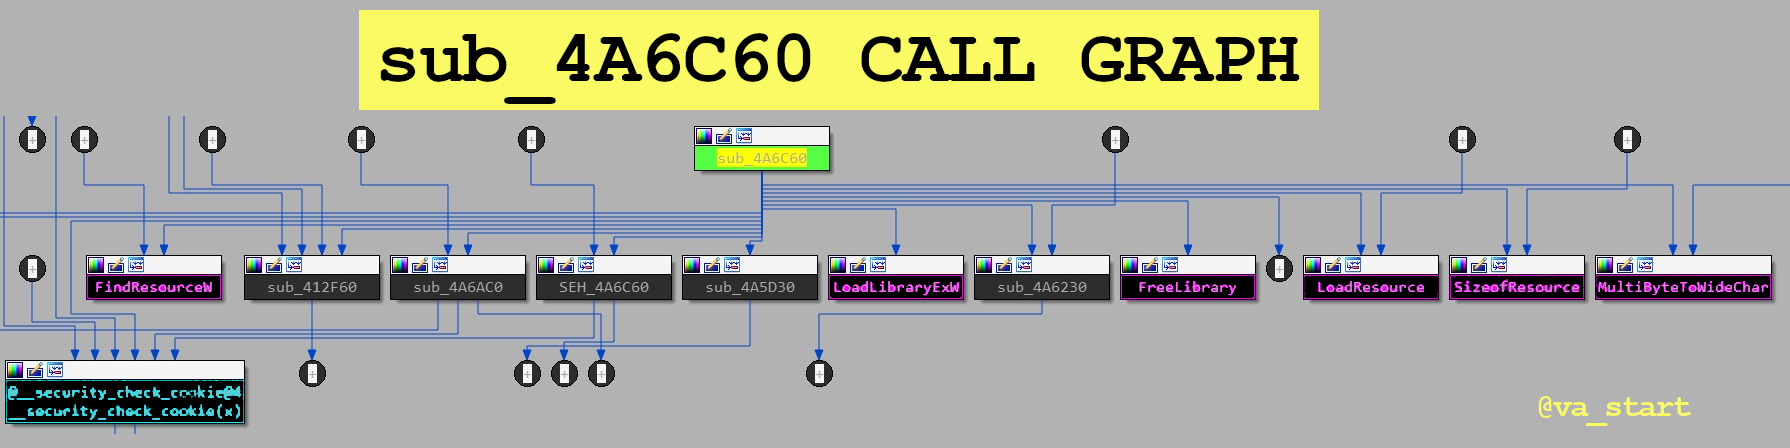
sub_4a6c60 call graph Because sub_4a6c60 calls
LoadLibraryExW,FindResource,LoadResource,SizeofResource, andFreeLibrary-all functions related to loading resources- we can (safely) assume sub_4a6c60 handles loading resources. We figured this all out without looking at one line of code!Let’s look at another example: sub_82061A’s call graph is below.
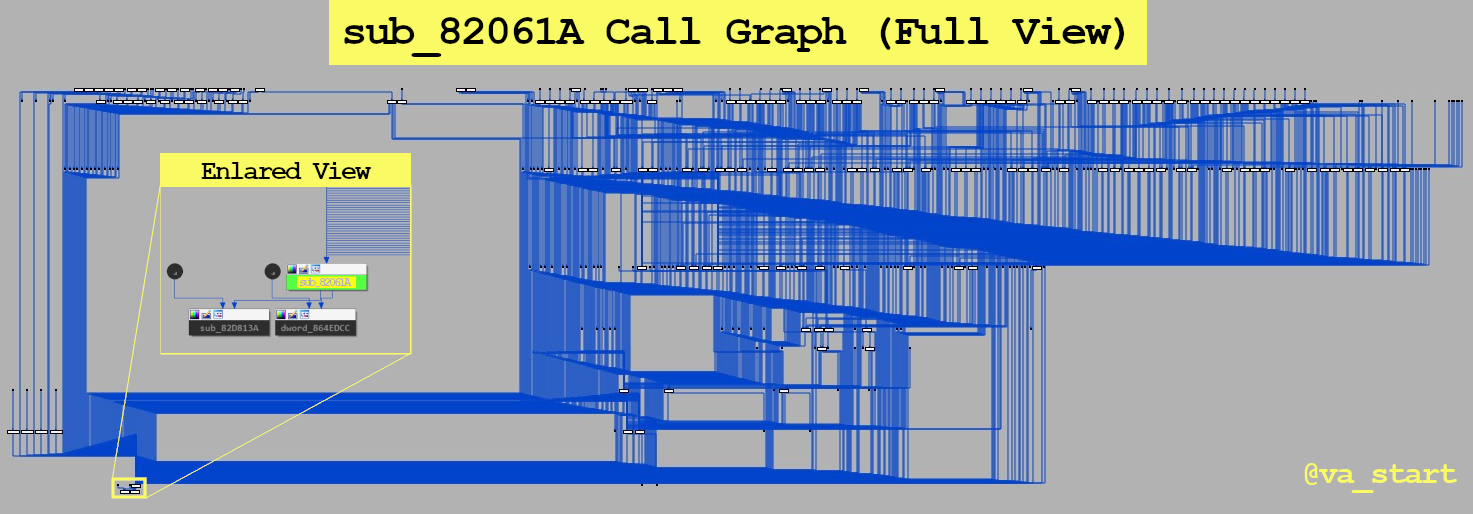
sub_82061A call graph Notice this function is called from many places. This limits the logic this function could have handled, since its code must be useful for many other unique functions. With this in mind, further analysis showed this is a panic function.
For this type of analysis use IDA’s “Proximity browser” opened from the View menu.
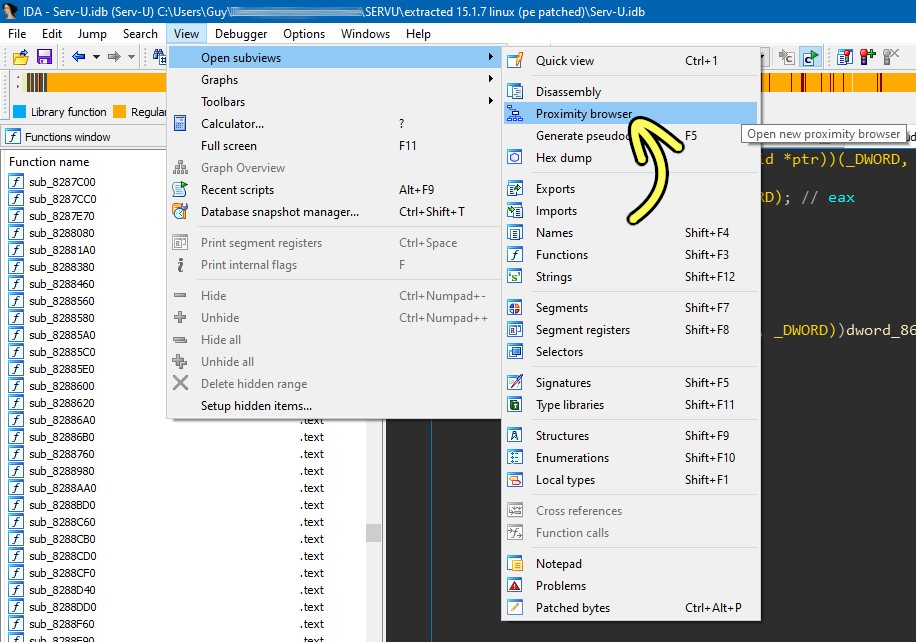
opening Proximity browser -
IDA auto-analysis missed a function argument because it was passed in an “unexpected” register?
Use the “__usercall” call convention with “@<register_name>” to declare function arguments & their location: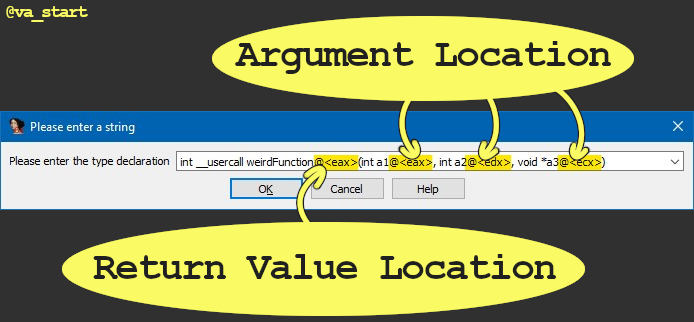
defining a custom calling convention for a function -
Buckle up buckaroos! Here’s the most useful RE strategy no one talks about:
Analyze the block layout before diving into ASM code. Layout view is available on many disassemblers, here’s how to best use it.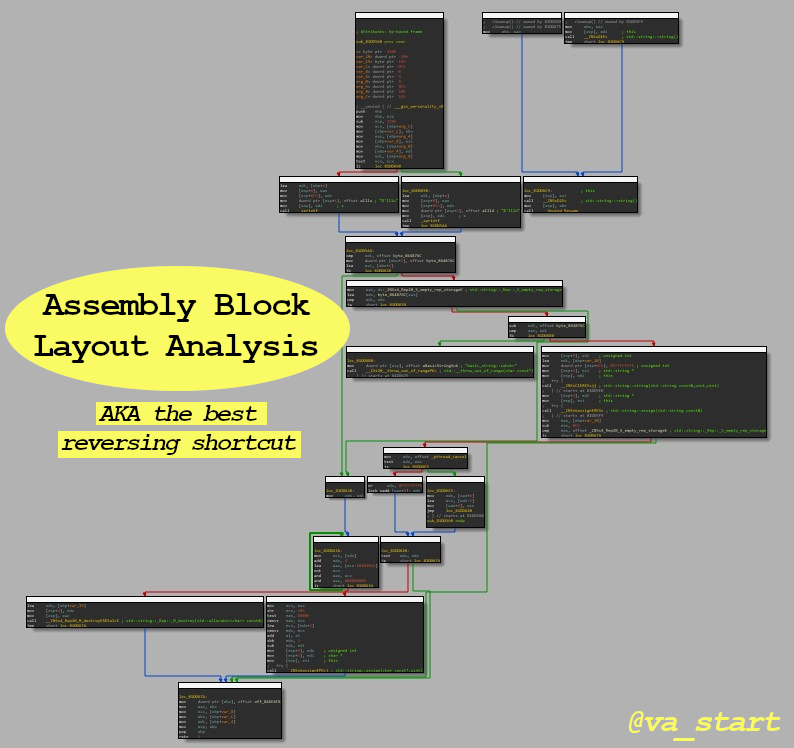
Let’s start with an easy example. The 1st image shows the layout of an “if” statement: the code splits to 2 paths.
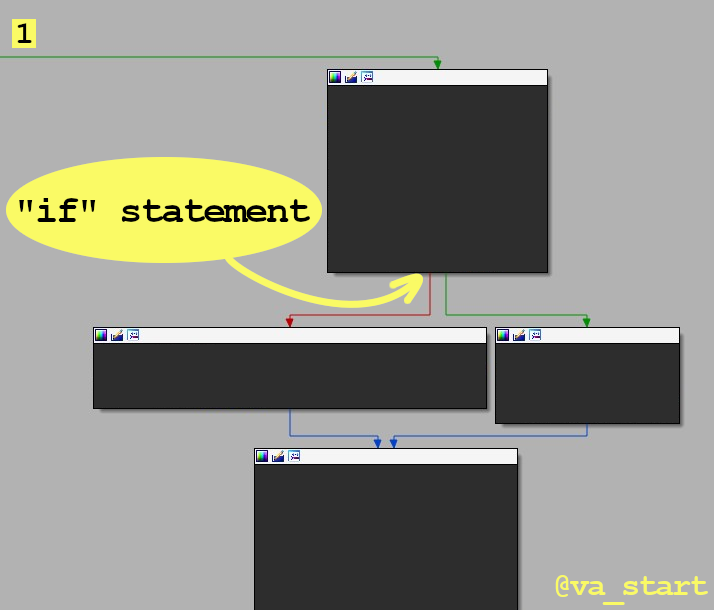
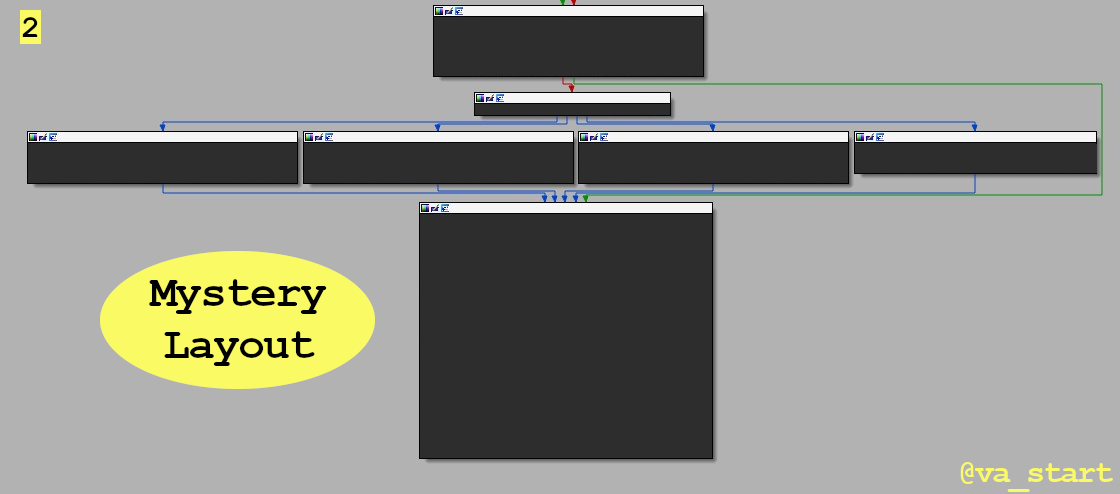
if statement as seen in assembly block view Exercise: What layout does the picture below show? Answer is below. (And the assembly is purposely hidden! That’s the point of this ;)
what is this layout? If you answered it’s a switch case statement, you’re correct :) Great! Let’s use our new killer skillz on func_1. Question: func_1 is most likely:
1. Computing a hash 2. Parsing a format 3. String comparison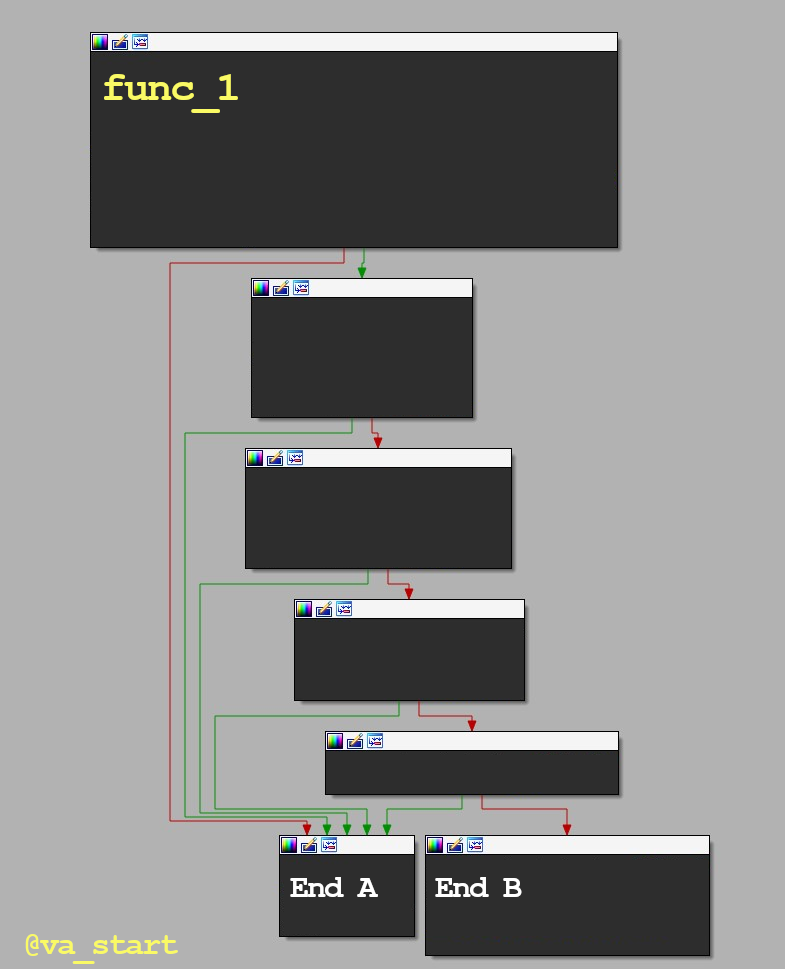
what is func_1 doing? The answer is #2, Parsing a format. Func_1 has many “if”s leading to a return block (End A), typical of format parsing code to bail early if it finds a corrupt field/magic value. Here is func_1 fully exposed to confirm our assumption:
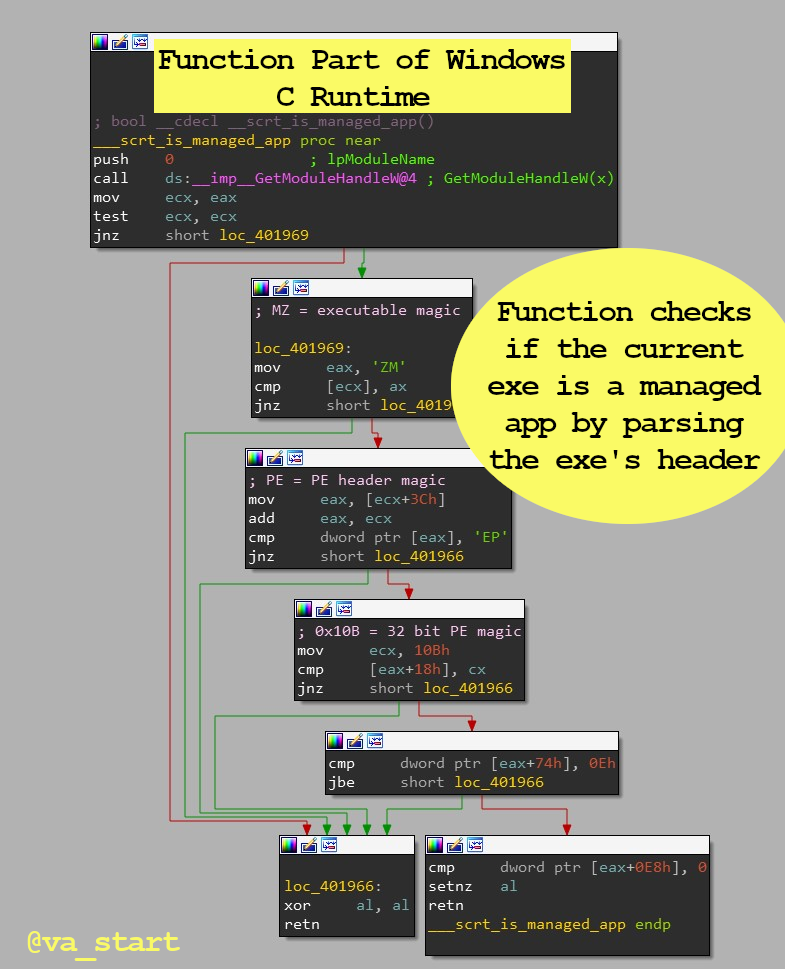
func_1 exposed. This function is parsing the header of an MZ exectable Last example; what is func_2 most likely doing? 1. Computing a hash 2. Parsing a format 3. String comparison Answer is below the image.
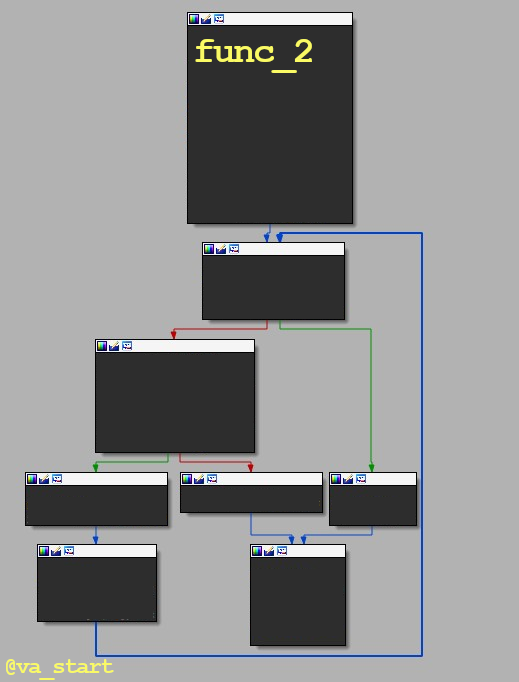
what is func_2 doing? The answer is #3, String comparison. Func_2 has a loop, typical in str related funcs which use the loop to iterate over the str’s chars. Also, we can rule out #2 with knowledge from the previous exercise (func_1), and we can rule out #1 (Computing a hash) from the very first reverse engineering tip I gave: has functions are long and branchless.
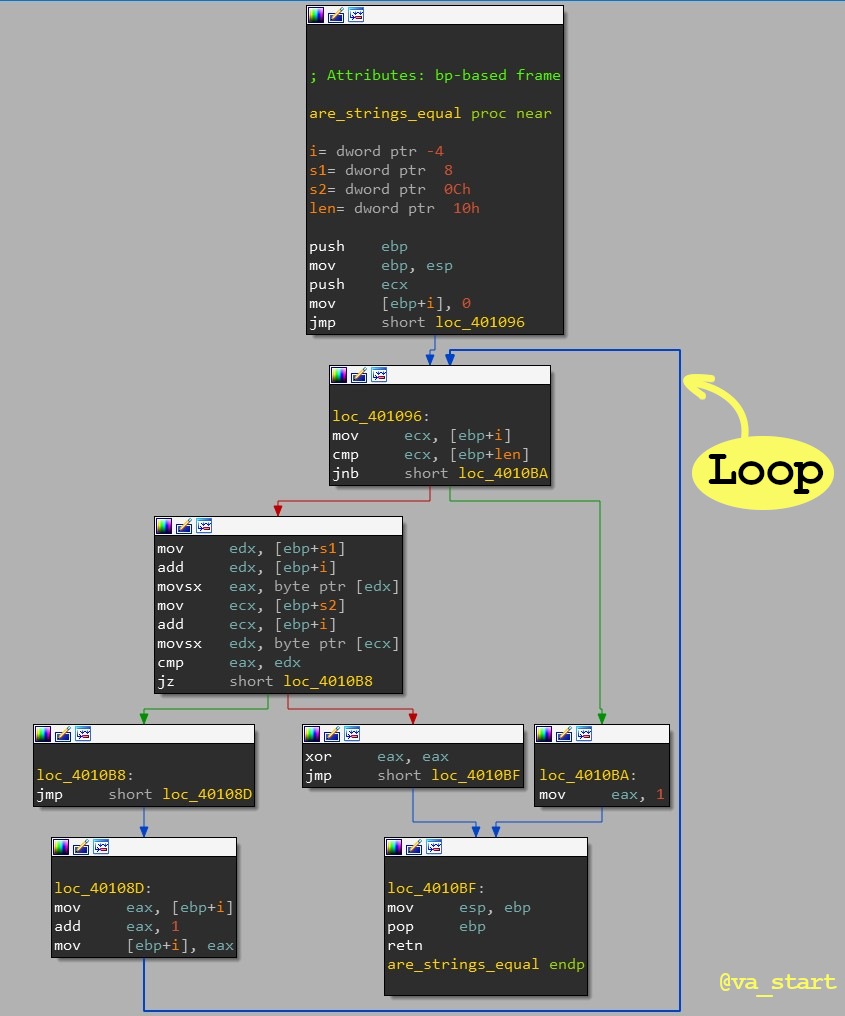
func_2 naked and exposed -
The Reverse Engineering tip better than anything technical I can share: Reverse Engineering isn’t a 1337 h4ck3r only reserved field! Like anything else: It’s open to everyone! And like any skill, “just” enjoy it, work hard, and you’ll get it.
Easier said than done, but don’t be discouraged when things are hard. I like to think of this @maddiestone story where she learned a lot from reversing printf when she was just a begginer in reverse engineering.
A setback is only a waste if you didn’t learn anything from it
If you think I earned your follow, my twitter is @whtaguy and I appreciate you showing support. Thank you!
If you have any questions leave a comment on this post or tag me on Twitter - I reply fairly quickly :)